Model explainability using Window Visualization and Grad-CAM
Model explainability is the process of comprehending a machine learning model by analyzing the model predictions using explainability tools. It provides insights about what the model focus on before making a prediction, thus ensuring that the model is making correct and un-biased predictions. It is a crucial step in building a trustworthy and reliable machine learning model.
IMAGIMOB Studio offers the following tools to analyze the model predictions:
- Window Visualization
- Gradient-Weighted Class Activation Mapping (Grad-CAM)
To use the above mentioned tools download the model files and Importing the predictions after the model is trained in the Imagimob Cloud. This helps you to visualize the data, label, preprocessor and model predictions tracks in a single session file.
Window Visualization
Window Visualization is an analyzing tool that provides a clear understanding about the model performance. It helps you in visualizing what the model is looking at any given timespan while making a prediction. This gives better insights into why the model behaves the way it does in relation to a certain part of the recording. Window visualization helps in debugging the model by identifying the areas where the model makes incorrect predictions.
To analyze the model predictions using window visualization, follow the steps:
-
Open the session file that displays the data, preprocessor and model predictions tracks.
-
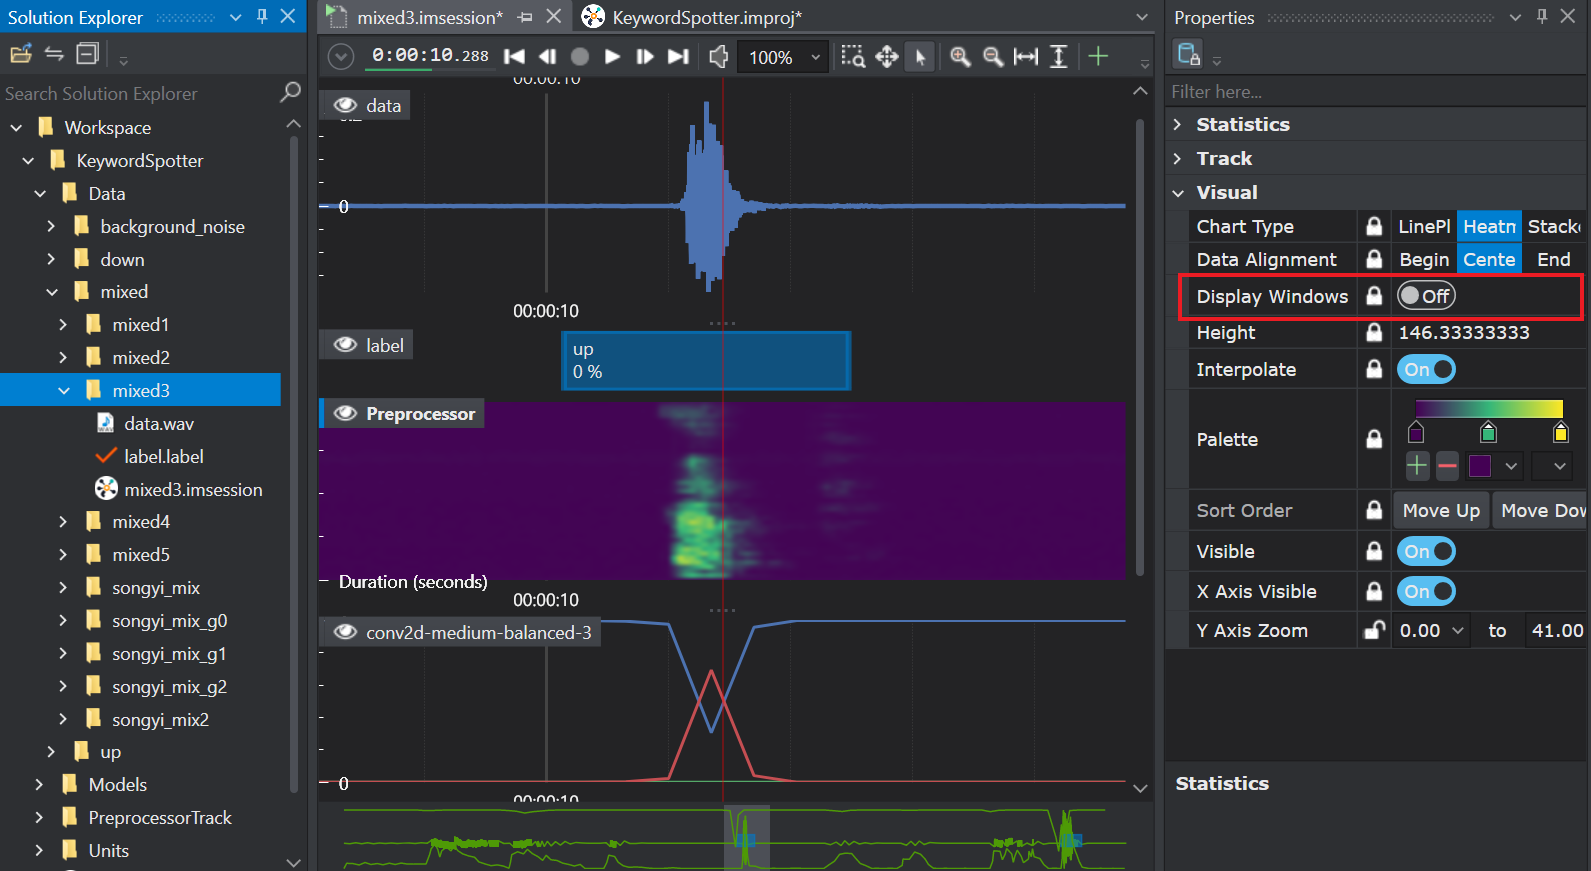
Click in the preprocessor or the model prediction track region to enable the Display window radio button in the Properties window.
-
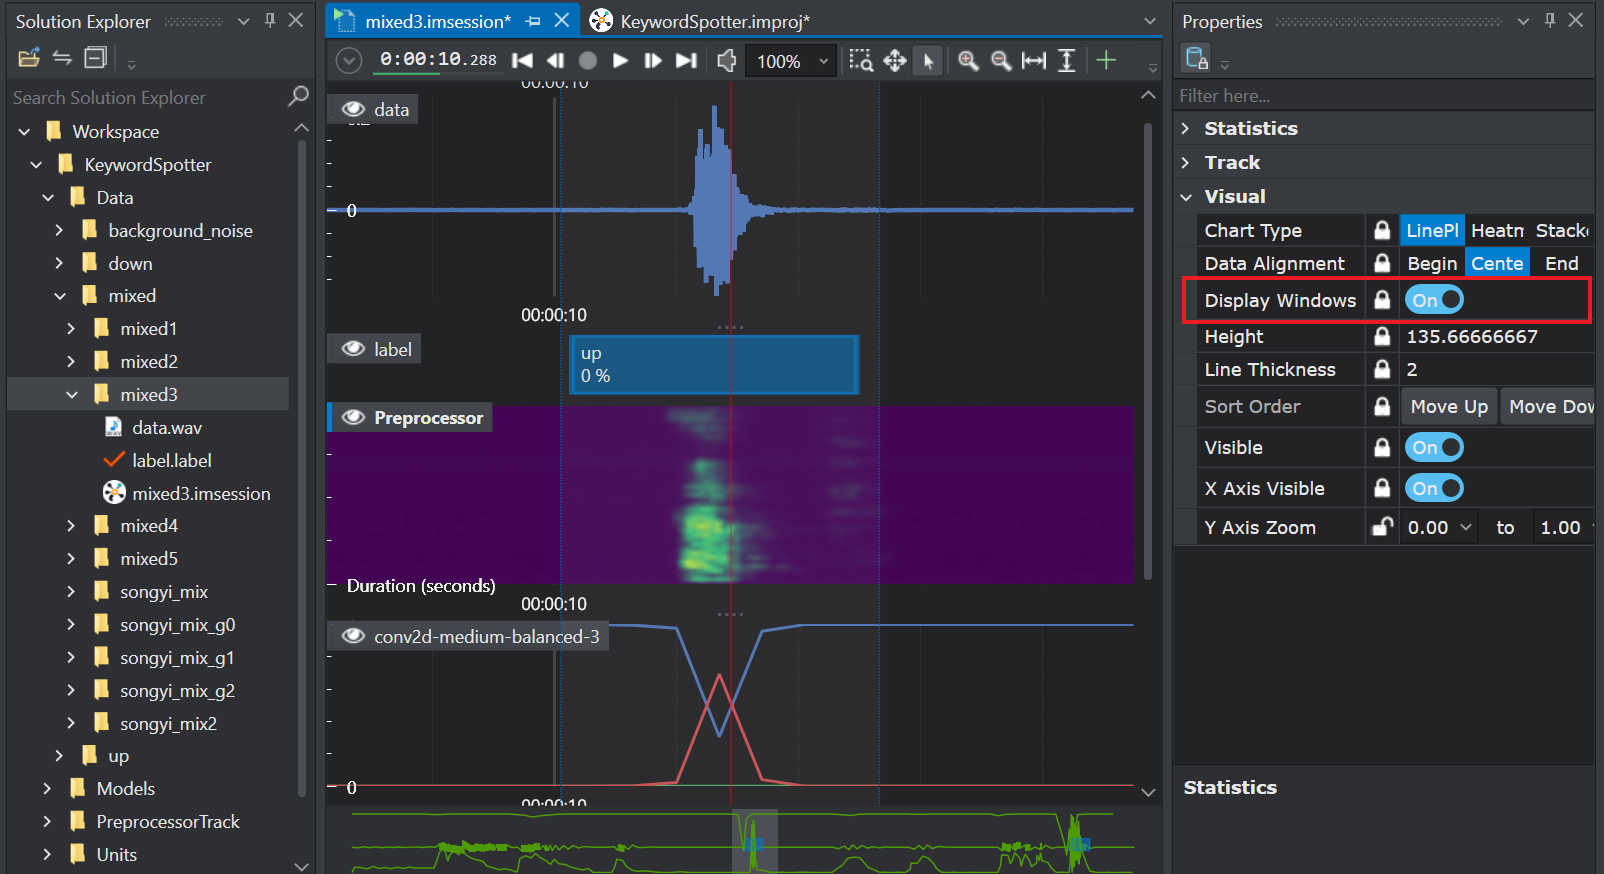
Toggle the Display window radio button to see the window visualization frame. Zoom in the timeline if the window visualization frame is small. The size of the frame depends on the stride configured in the Contextual Window. To know more, refer to Configuring the preprocessor.
To ensure the model is working as expected, visualize the different aspects of the model by mapping the data track, preprocessor and the model predictions.
Gradient-Weighted Class Activation Mapping
Gradient-weighted Class Activation Mapping (Grad-CAM) is an analyzing tool that provides visual explanations for the convolutional based models, by highlighting the key regions of the data based on which the model made the predictions. The transparency and explainability of Grad-CAM helps in identifying the areas where the model made the incorrect predictions, thus helping in enhancing the performance of the model. Grad-CAM heatmap is mostly represented in red-to-blue color scale, where the red region signifies the most focussed area while the blue region signifies the least focussed area when making a prediction.
IMAGIMOB Studio supports the Grad-CAM functionality for Convolution2D models.
Make sure you enable the Grad-CAM functionality before sending the model training job to Imagimob Cloud.
To enable Grad-CAM, follow the steps:
-
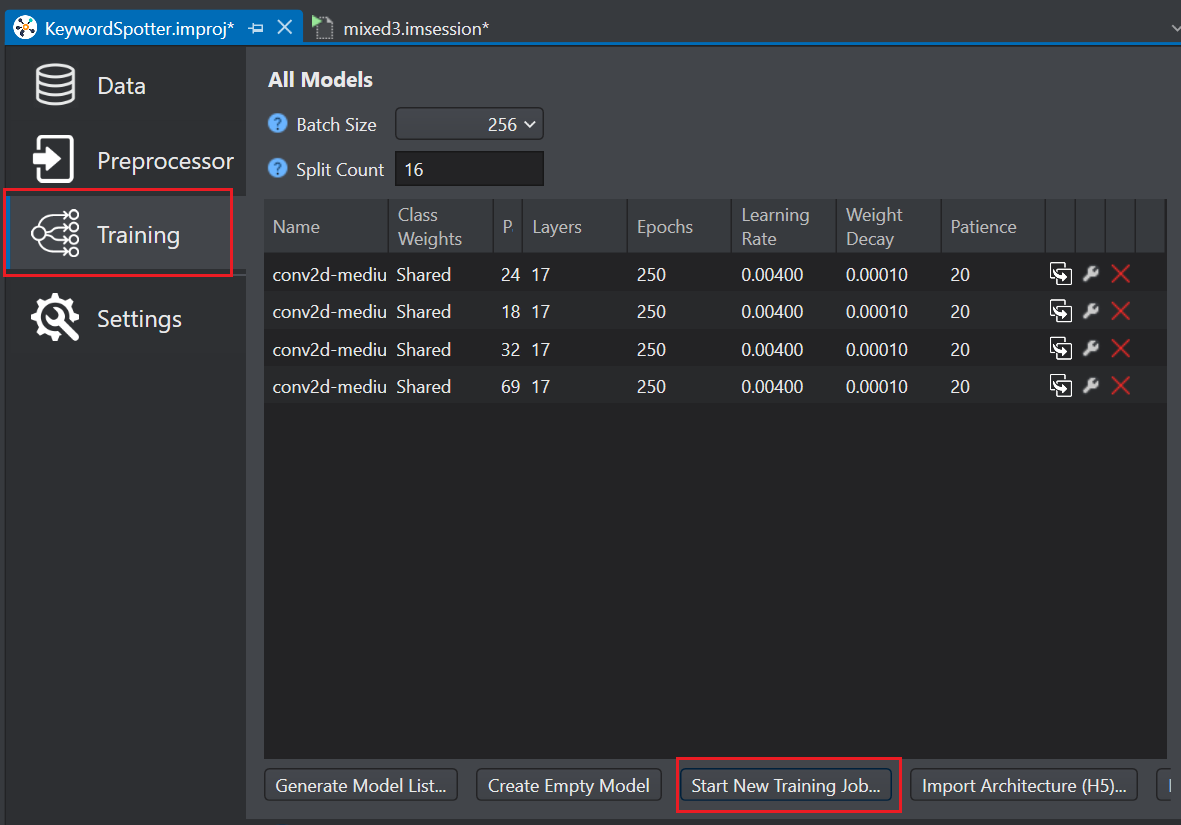
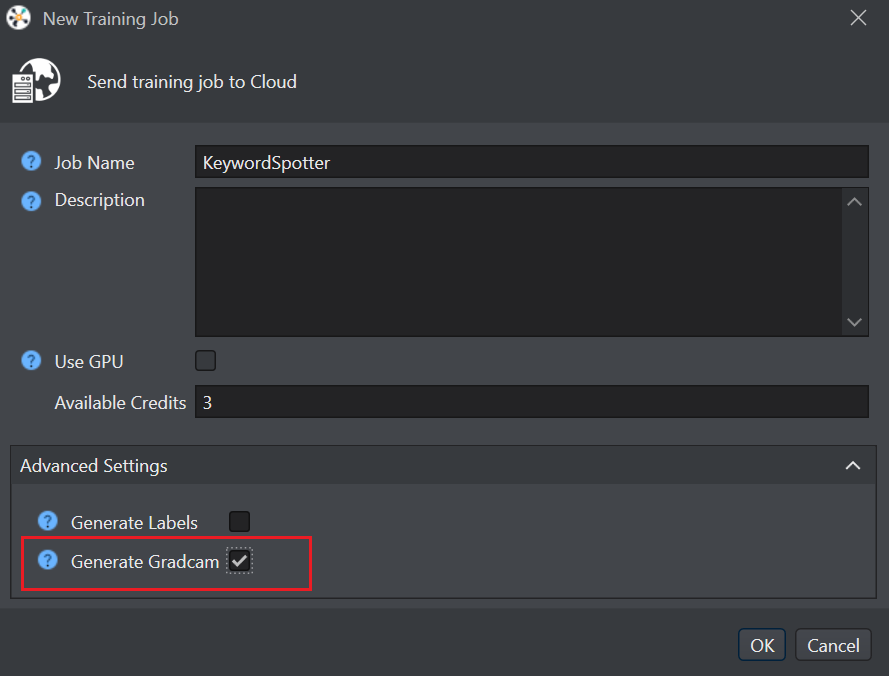
Click Start New Training Job to start the model training.
-
Expand the Advanced Settings drop-down and enable the Generate Gradcam checkbox.
-
Click Ok.
To analyze the model predictions using Grad-CAM, follow the steps:
-
Open the session file in which you want to analyze the model prediction.
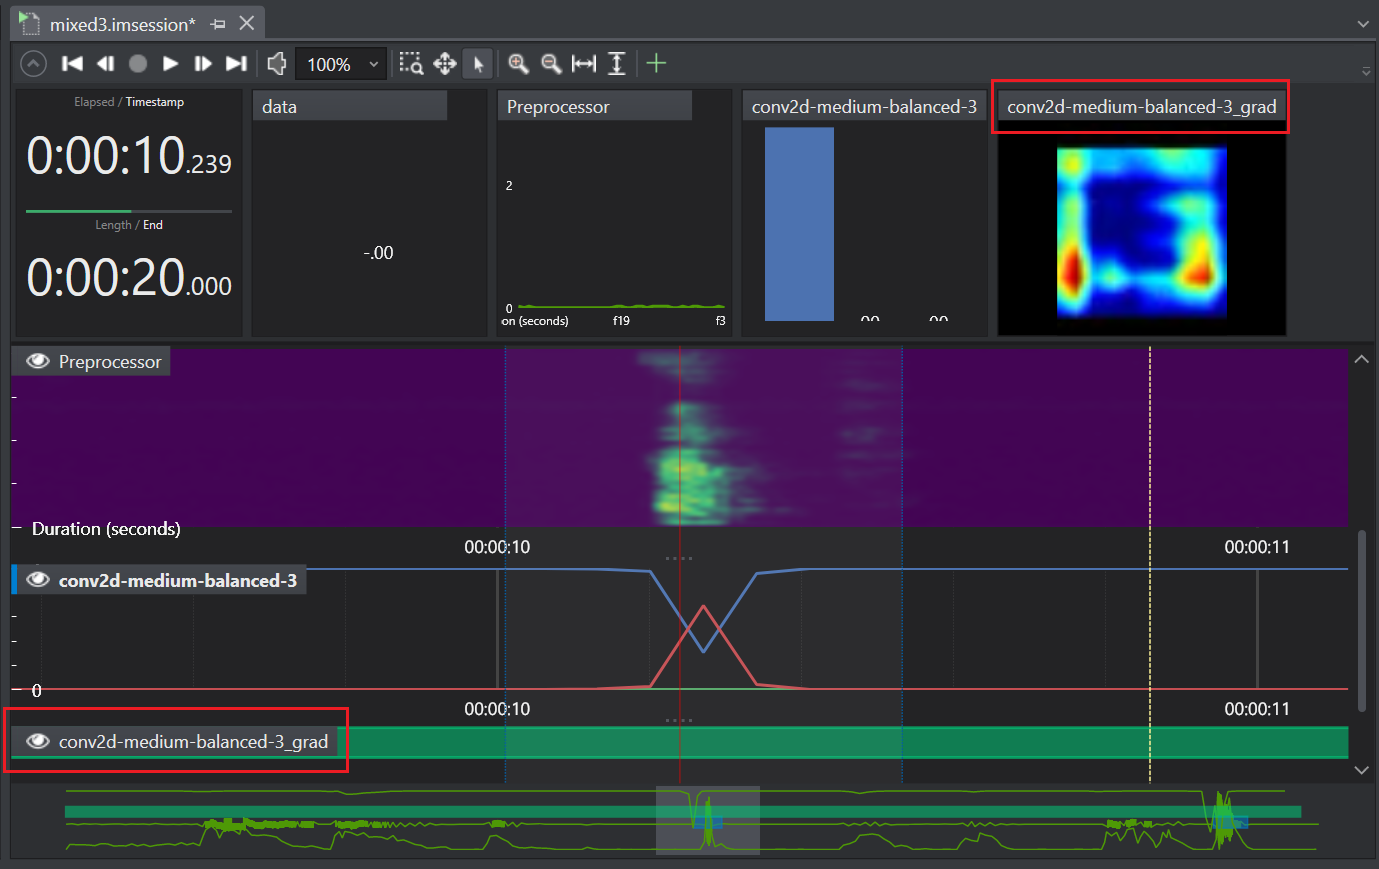
-
Zoom in the timeline to interpret the grad-CAM heatmap.
Using the Grad-CAM functionality may slow down the evaluation process and increase the cost for the training job.