Graph UX
Graph UX is an intuitive interface to visualize end-to-end machine learning workflow as graphs. This graph machine learning framework is designed to provide a clear understanding of the modelling workflow from building to evaluating machine learning models. Use the Graph UX library to create a machine learning workflow by dragging and dropping machine learning components on the canvas.
The modern day machine learning is all about neural networks, which are easily represented as graphs. This analogy works throughout the machine learning development process, from data collection, model building, model training, all the way to model evaluation and deployment on device. By representing the data, the processing, the modelling, the training and evaluation runs in the same coherent view, with the same basic building blocks and concepts, everything is easier to work with.
What is improved in DEEPCRAFT™ Studio?
The previous DEEPCRAFT™ Studio UX and data processing or modelling engine limits which machine learning problems can be solved and what models could be created. It was difficult to process or visualize some models and represent certain use cases.
By updating the underlying architecture in DEEPCRAFT™ Studio, the foundation is in place to support any machine learning use case and any machine learning model in the future. The machine learning development workflow is now more transparent making the software easier to use. With the new UX, what is happening behind the scenes is also visible to you ensuring that there will be no disconnects or unexpected results between what you see when working with a model and what finally runs on the device.
The graph can also be represented with different levels of complexity. For novice users, we represent the workflow with simpler graphs having composite nodes, so that it is easy to get an overview and tune high level parameters. All this while still allowing expert users to zoom in and control the details.
What can I do using Graph UX?
Graph UX offers the following functionalities:
The first release of Graph UX covers data collection, model evaluation, and code generation. In future releases, Graph UX will support the entire end-to-end machine learning workflow, including data management, data cleaning, augmentation, and model training.
How do I get started with Graph UX?
You can create an Empty Graph UX project or Starter Graph UX project containing an example graph.
To create a Graph UX project, follow the steps:
-
Open the DEEPCRAFT™ Studio.
-
Click New Project in the welcome screen. The welcome screen appears, when you open the DEEPCRAFT™ Studio for the first time.
OR
Go to File and select New Project. The New Project window appears. -
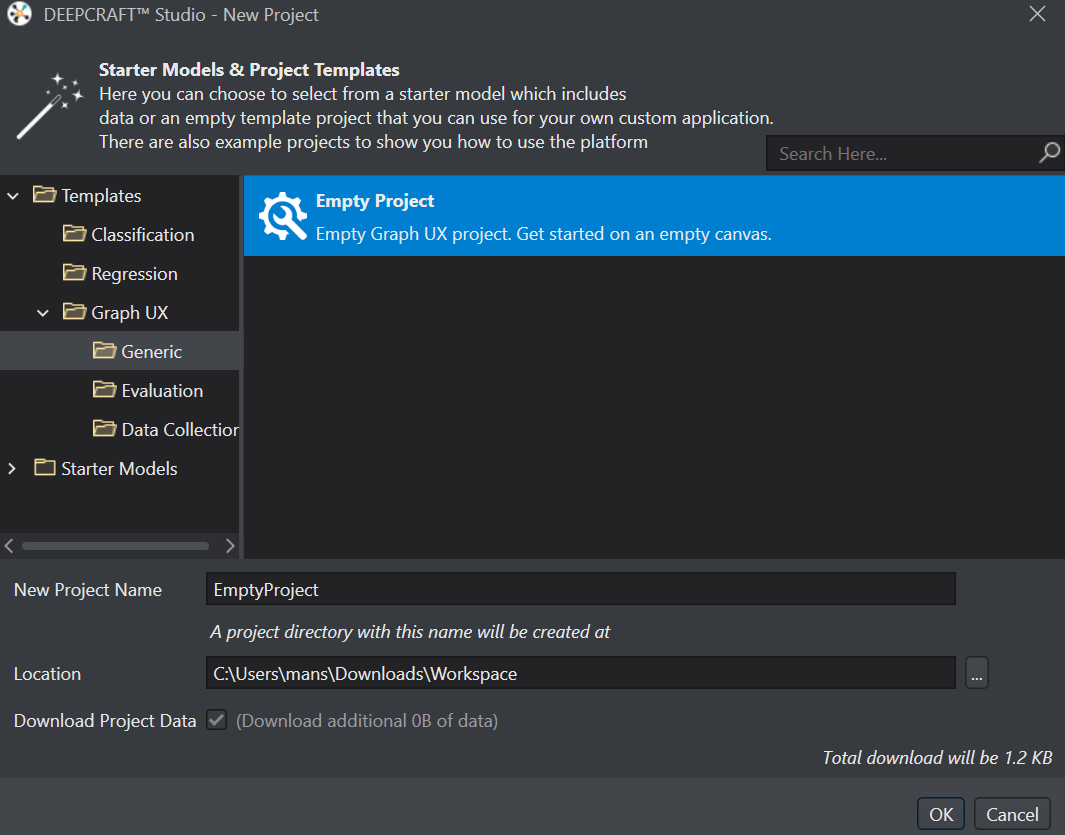
Expand Templates> Graph UX to select project type that meets your requirement:
-
If you want to create a graph from scratch for real-time data collection, data labeling, model evaluation or any other use-case, select the Generic directory and click Empty project.
-
If you want to use an example graph to perform a real-time evaluation of the audio or acoustic model using a built-in PC microphone or an external development board, select the Evaluation directory and click Live Model Evaluation.
-
If you want to use an example graph to perform a real-time evaluation of the audio or acoustic model using a recorded file, select the Evaluation directory and click Model Evaluation From File.
-
If you want to use an example graph to perform a real-time evaluation of the object detection model, select Evaluation directory and click Model Evaluation for Object Detection.
-
If you want to use an example graph to collect real-time data using a built-in PC microphone or an external development board, select Data Collection directory and click Live Data Collection.
-
If you want to use an example graph to collect real-time data using a built-in PC camera, external webcam or mobile phone camera via third-party applications, select Data Collection directory and click Object Detection Data Collection.
-
-
In New Project Name, enter the name of the project.
-
In Location, specify the location where you want to create the workspace and the project directory.
-
Select Download project data checkbox to download the project data for that particular project. The project directory is downloaded to the workspace in DEEPCRAFT™ Studio.
After you have created the required Graph UX project, refer to the next section to understand the basic concept of Graph UX.