Collecting and labeling data using Radar sensor
You can collect radar data from the sensor on the PSOC™ 6 AI Evaluation Kit to develop models such as hand gesture detection models, macro and micro presence detection models or any other use case according to your requirement. Using the Graph UX functionality, you can collect and label real-time acoustic data simultaneously.
You can collect data concurrently from microphone, IMU, magnetometer, and pressure sensor. However, you must collect data from Radar sensor independently, without concurrent data collection from any other sensors.
Radar Data Configuration
When capturing radar data for use cases such as gesture detection, micro presence detection or macro presence detection, the radar configurations are pre-configured by default. However, if you wish to use a different radar configuration for data collection, you can import custom radar settings using a binary file. Refer to the steps below to understand how to generate a binary file:
Generating binary file for custom radar configuration on PSOC™ 6 AI Evaluation Kit
-
Generate the config json file using the Radar Development Kit .
-
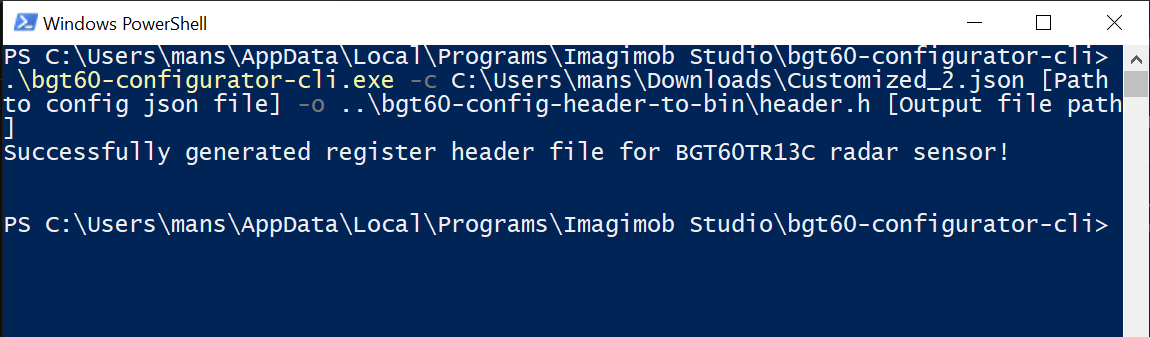
Press Windows + R to open the Run tool, navigate to %LOCALAPPDATA%\Programs\Imagimob Studio\bgt60-configurator-cli.
-
Press Shift and right-click to open PowerShell windows and run the command .\bgt60-configurator-cli.exe -c [Path to config json file] -o [Output file path]
-
If you want to see other available options, run .\bgt60-configurator-cli.exe —help
-
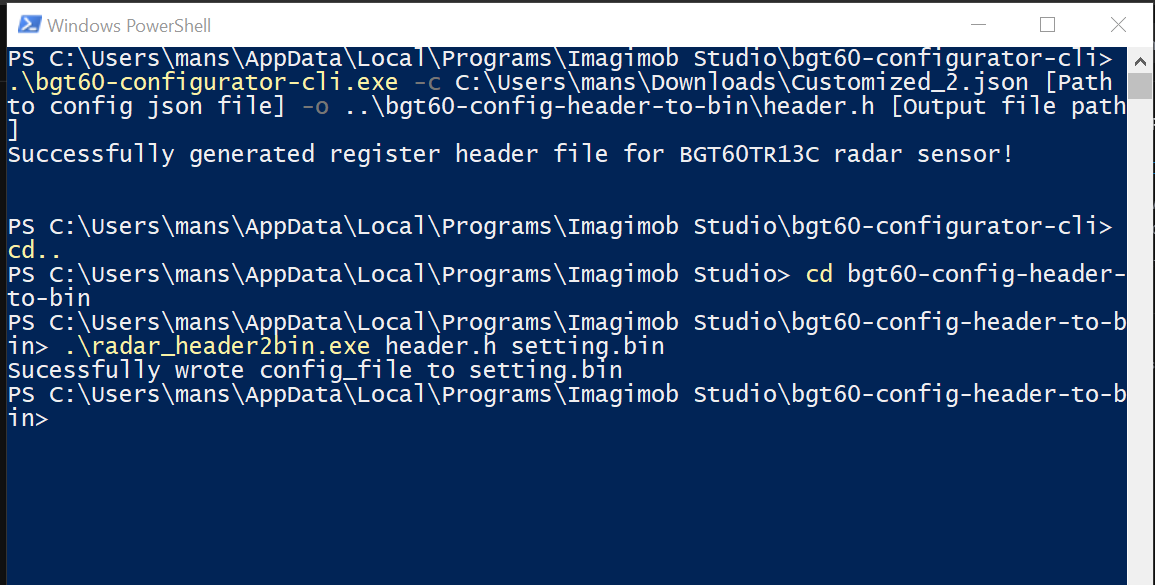
Navigate to %LOCALAPPDATA%\Programs\Imagimob Studio\bgt60-config-header-to-bin and run the command .\radar_header2bin.exe [Path to file generated in step 3] [Output file path]
Now, use this binary file to stream data from the PSOC™ 6 AI Evaluation Kit into Studio with different radar configurations. Instructions on referring the file within Studio are provided Setting up the Radar Sensor section.
After connecting the kit to the PC and creating a Graph UX project, let’s set up the Radar Sensor unit for data collection and Predefined unit for data labeling on the canvas. Refer to Connecting PSOC™ 6 AI Evaluation Kit to PC/laptop and Creating a Graph UX Project to know the detailed steps.
Setting up the Radar Sensor
-
Navigate to the Node Explorer window, expand Boards> PSoC 6 AI (CY8CKIT-062S2-AI) and drag and drop the Radar sensor onto the canvas.
-
Navigate to the Node Explorer window, expand Library> Tracks and drag and drop the Data Track onto the canvas.
-
Click on the red icon in the Radar sensor node and drag over to the red icon in the Data Track node. This creates a connection between the two nodes.
-
Click on the Radar sensor node to edit the settings in the Properties window.
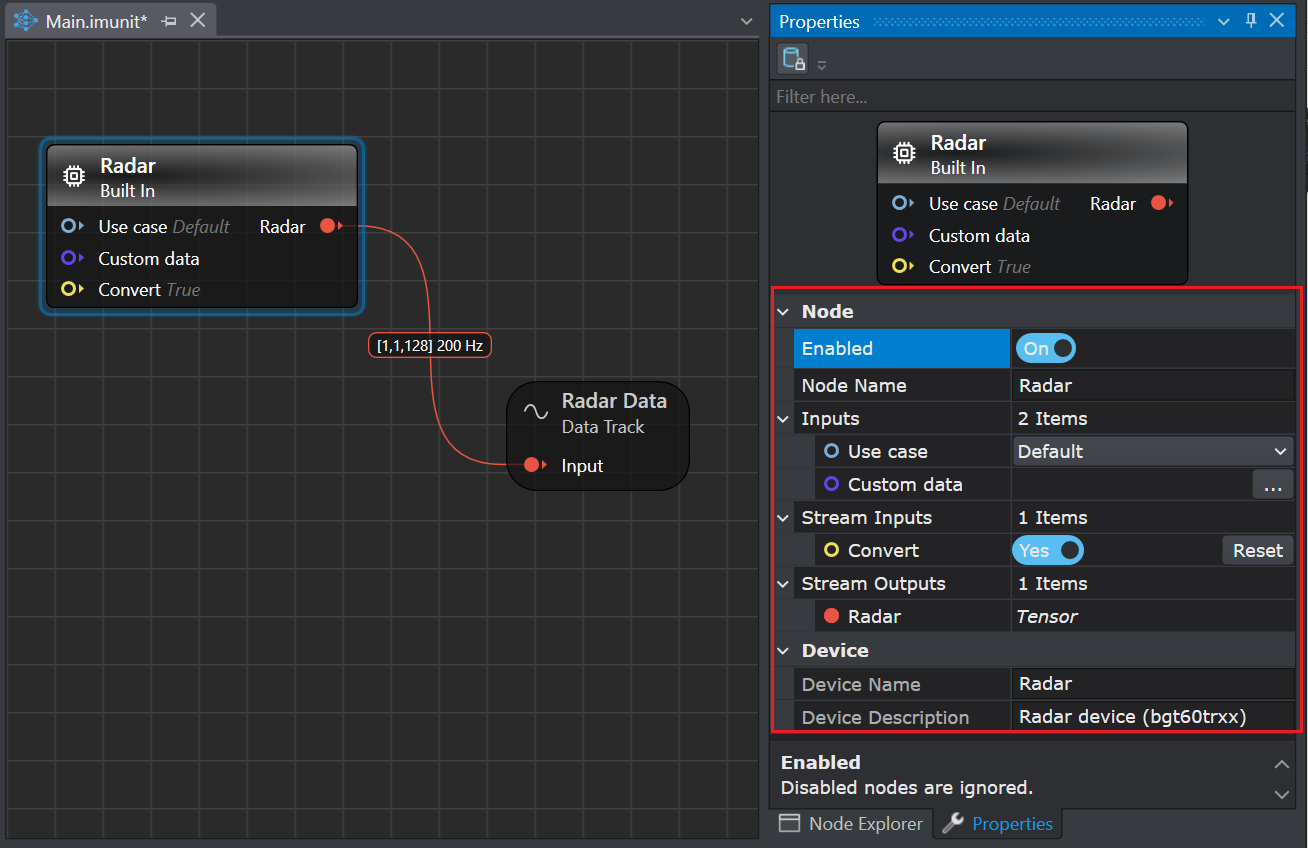
Setting the Properties of Radar Sensor Node
Sensor node Properties Node Enabled: Turn the radio button ON or OFF to enable or disable the node respectively.
Node Name: Enter the name you want to assign to the node.Use Case Select the use case for which you want to stream the radar data:
Default: Select the Default option for testing purposes, such as verifying whether the radar is streaming data.
Gesture: Select the Gesture option to collect data for building a model that detects different hand gestures, such as Left, right, up, down, push.
Macro Presence : Select the Macro Presence option to collect data for building a model that detect major movements into or through the field of view (motion detection).
Micro Presence : Select the Micro Presence option to collect data for building a model that detect small movements such as finger gestures or small head movements in a typical smart home environment. These include working on a laptop or keyboard, or normal breathing, and blinking of the eyes in sitting or standing positions (in line of sight).
Custom: Select the Custom option to stream radar data with the custom radar settings. In the Custom data, select the binary file with the radar settings and save the graph to apply the configurations. To know how to obtain a binary file, refer to Generating binary file for custom radar configuration on PSOC™ 6 AI Eval Kit. Note that, if the custom settings has a high data rate, it may cause issues when collecting radar data due to the data speed limit.Stream Inputs Covert: Turn the radio button Yes or No to enable or disable the conversion of the output stream into float 32 respectively. Stream Outputs Radar: Displays the name of the output stream from the sensor node. Device Device Name: Displays the name of the sensor.
Device Description: Displays the description of the sensor.
After setting up the Radar sensor node, you can utilize the same graph to label the real-time data, by adding a Predefined Labels unit onto the canvas. Define the classes in the Predefined Labels node for one time and utilize the defined classes to label the data on a click of button.
Setting up the Predefined Labels
-
Navigate to the Node Explorer window, expand Library> Annotation and drag and drop the Predefined Labels unit onto the canvas. The Predefined Labels unit displays the default classes.
-
Define the classes in Predefined Labels node by entering every class in a new line.

After defining the classes, start collecting and labeling data simultaneously.
Real-time data collection and data labeling
When streaming radar data with many features and/or a high sample rate, the timeline may become slow or laggy. To improve the timeline performance, click the eye icon next to the affected track. This disables timeline plotting for the hidden track but continues streaming and recording data in the background. Click the eye icon again to unhide the track and view the plotted data after you stop recording.
-
Navigate to the toolbar and click the Start button to open the session file (live.imsession). An empty session file opens displaying the pre-defined classes in the Labels bar.
-
Click the Record button to start capturing the real-time data.
-
In the Labels bar, select a class to start adding labels to the streaming data.
-
Deselect the same class to stop adding the labels. Similarly, you can enable or disable the other classes and label the data.
-
Click the Record button to stop collecting the data.
-
Select File > Save to save the session file, data track and label track. The Save New Session window appears.
-
In Location, click the three dot and select the desired location to save the files.
-
In Session Name, enter the name of the session file.
-
Under Track Options, set the following:
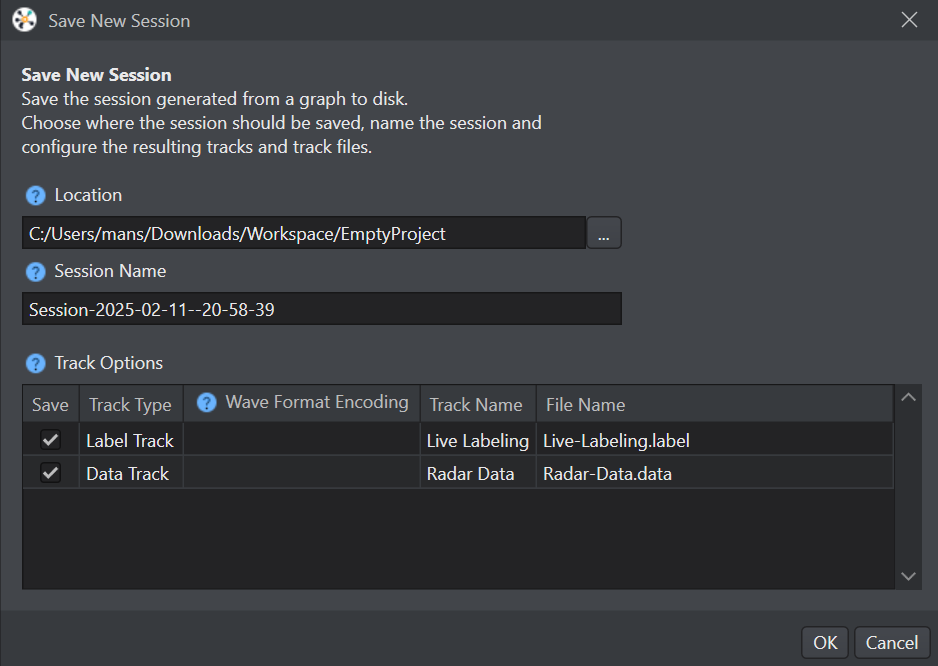
- In Track Name, double-click the column to edit the track name, if required
- In File Name, double-click the columns to edit the track name, if required
-
Select the save checkbox corresponding to the tracks you want to save.
-
Click OK to save the files.
-
Repeat the instructions from step 2 to collect and save data in multiple session files.
After collecting the data, add data to the required project and start with the machine learning workflow in Studio. Refer to Create project and Add data to project to know more.
If you prefer not to collect and label data simultaneously, you can first collect the data. Once the data collection is complete, simply press the play button in the session and begin labeling by selecting the appropriate labels in the Labels bar.