Real-Time Data Streaming with PSOC™ Edge E84 Evaluation Kit
This topic provides information on how to stream real-data from various sensors present in the PSOC™ Edge E84 Evaluation Kit into DEEPCRAFT™ Studio. You can add additional data to your existing projects or build your own dataset from scratch. You can collect both labeled and unlabeled data, depending on your project requirements.
 |
|---|
Before you start collecting data using the PSOC™ Edge E84 Evaluation Kit, make sure to flash the kit with the Streaming Firmware. For step-by-step instructions, refer to Streaming Firmware for PSOC™ Edge E84 Evaluation Kit.
What type of data can be collected using the PSOC™ Edge E84 Evaluation Kit?
After you have flashed the streaming firmware, you can collect various types of data from multiple sensors, including:
- Audio Data: Pulse Density Modulation (PDM) and Pulse Code Modulation (PCM) audio data can be collected from the microphone at sample rates of 8 kHz, 16 kHz, 22.05 kHz, 44.1 kHz, 48 kHz.
- Inertial Measurement Unit (IMU) Data: Data from the 6-axis IMU (accelerometer and gyroscope) can be sampled at frequencies of 50 Hz, 100 Hz, 200 Hz or 400 Hz. This allows for acceleration and gyroscopic angular rate sensing in each spatial direction. The IMU sensor can be configured to collect data from only the accelerometer, only the gyroscope, or both.
- Magnetometer Data: The 3-axis magnetometer provides data at a sample rate of 50 Hz, 100 Hz, 200 Hz or 400 Hz, enabling geomagnetic field direction and strength sensing.
How to collect data from the PSOC™ Edge E84 Evaluation Kit into Studio?
After flashing the kit with the Streaming Firmware, you can choose to collect data over Serial connection or Wi-Fi network.
Stream data over serial connection: Connect the PSOC™ Edge E84 Evaluation Kit to the laptop or PC through USB connector (J30) using a Type-C USB cable. After connecting the kit, navigate to Node Explorer Window> Boards to check if the board is connected properly to start collecting data. The PSOC™ Edge E84 Evaluation Kit, along with all the sensors should be displayed under the Boards.
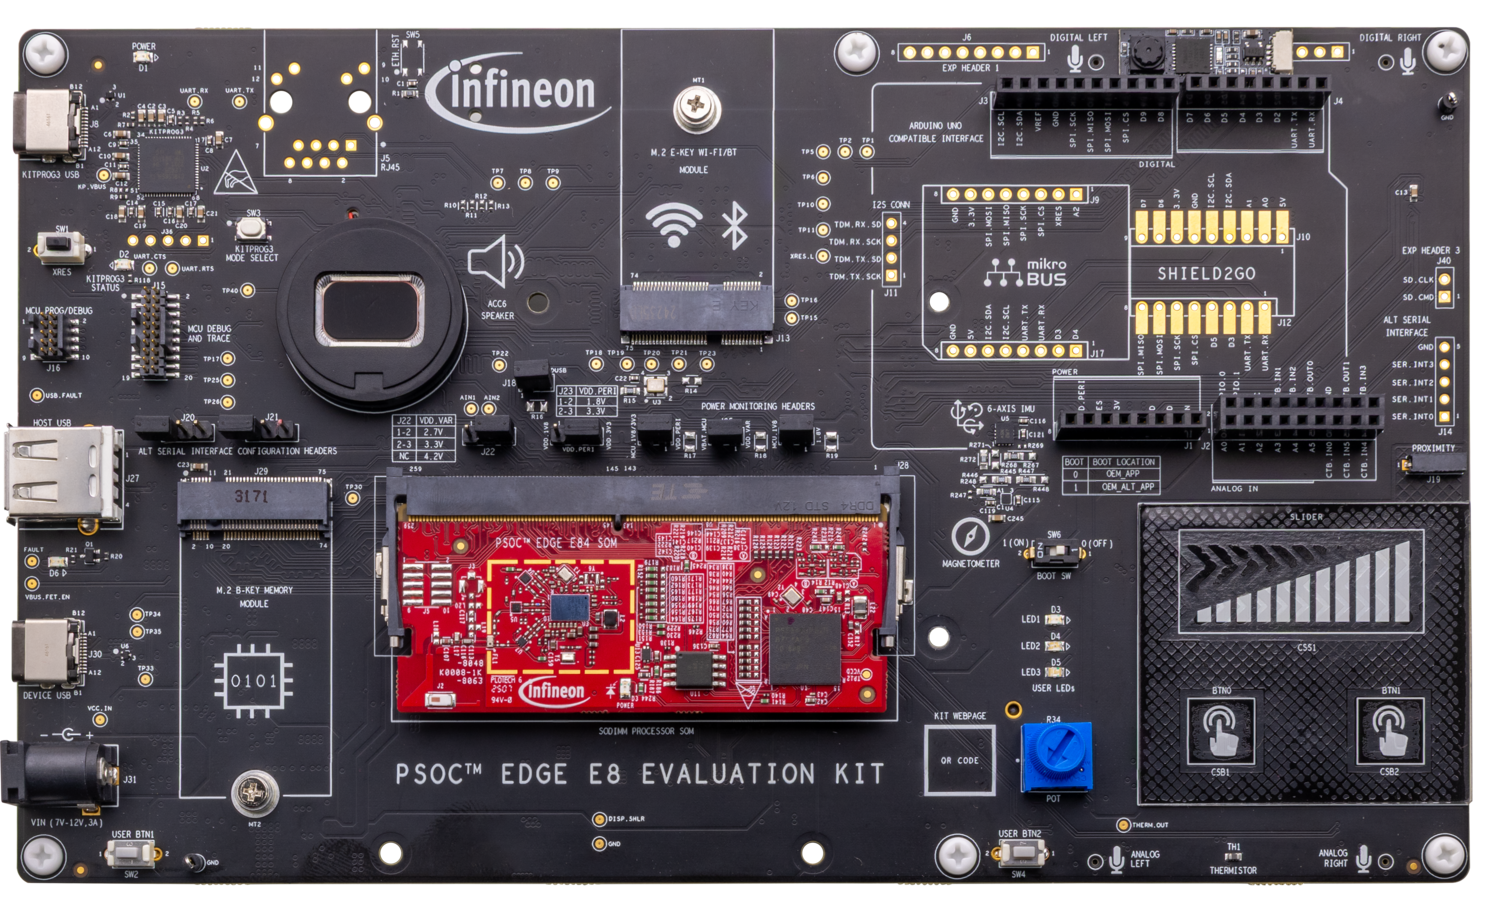
Stream data over Wi-Fi network: Connect the PSOC™ Edge E84 Evaluation Kit to the laptop or PC through USB connector (J30) using a Type-C USB cable for enabling the Wi‑Fi service on the kit and selecting the kit in Studio to stream data. Refer to How to stream data into Studio over Wi‑Fi network for step-by-step instructions. After enabling the Wi‑Fi service in the kit, unplug the board from the PC/laptop and use the external power supply VIN connector (J31) to connect an external DC power supply input to the on-board regulators. The input range for this VIN supply is 7 V to 12 V. Place the board at the target location and start collecting data.
Before streaming data over Wi‑Fi, flash the board with the hex file hosted after 2026‑05‑12. The hex file includes firmware for both Wi‑Fi and serial data streaming. If you flashed the board before 2026‑05‑12, you can only stream data over serial connection. Re-flash the board to enable Wi‑Fi data streaming functionality. Refer to Streaming Firmware for PSOC™ Edge E84 Evaluation Kit to know how to flash the hex file onto the kit.
How to stream data into Studio over Wi‑Fi network
Before streaming data from the PSOC™ Edge E84 Evaluation Kit into Studio over the Wi‑Fi network follow the prerequisites and steps below.
Pre-requisites:
- PSOC™ Edge E84 Evaluation Kit
- USB C cable
- Stable Wi‑Fi network
- UART terminal software such as Tera Term, Putty
- Battery
Step 1: Setup and Start Wi‑Fi Streaming on the board
-
Connect the KitProg3 USB connector (J1) port on the board to the PC using the USB cable.
-
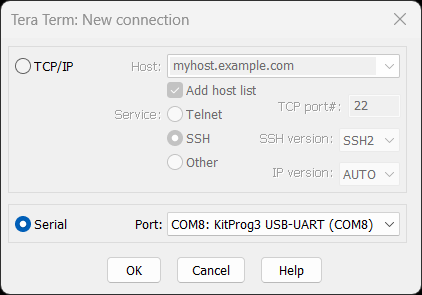
Open Tera Term and select Serial as the connection type.
-
Set Port to the COM port corresponding to your board from the drop-down list and click ok.
-
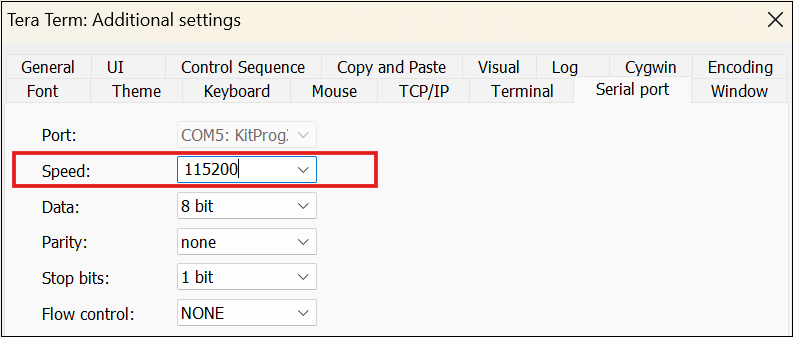
Go to Setup> Serial port amd set the Speed (Baud rate) as 115200 and click ok.
-
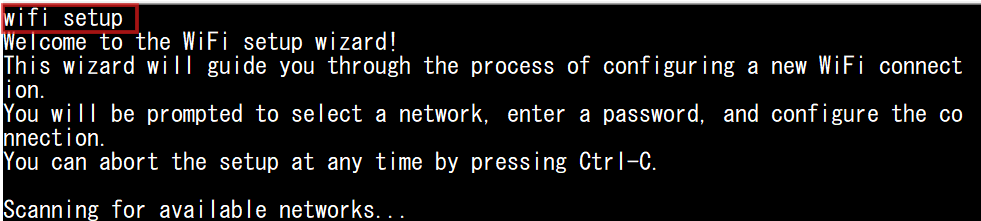
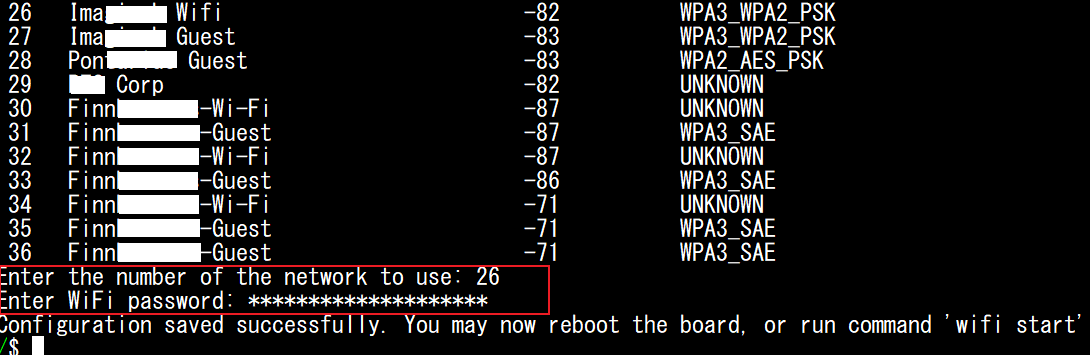
In the console, type the command: WIFI Setup and press enter. All the available wifi network appears. During Wi‑Fi setup, if you are prompted for a password, enter imagimob. You must change this default password immediately to a strong password using the command passwd to prevent unauthorized access.
-
In Enter the number of the network to use, type the number of the WIFI network you want to connect for streaming the data from your board to studio.
-
In Enter Wi-fi password, type the password of the wifi.
-
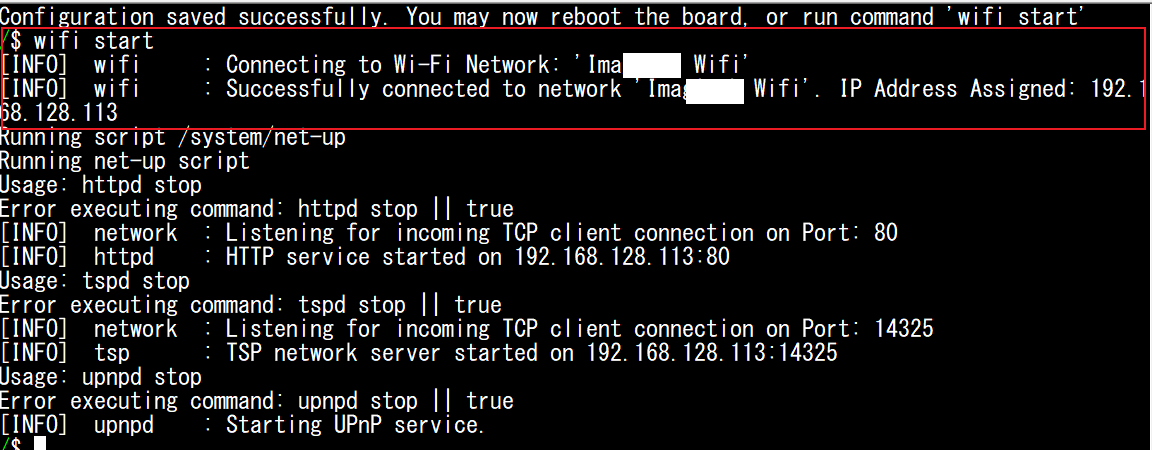
Type the command WIFI start to connect to the Wi-Fi network. An IP address is assigned to the board.
-
Type the command set_boardname boardname to change the default board name, in case you have multiple boards. If there is spaces in the name of the board, write the name between quotes. (This is an optional step).
To view the available user commands, type help in the terminal.
Step 2: Select the board in Studio to start streaming
-
Both the host PC and the board must be on the same network.
-
If your PC’s network is set to Public, Windows will block many outbound ports. To resolve this, change the network setting to Private by going to: Settings> Network & Internet> Wi-Fi> your network> Set to Private
-
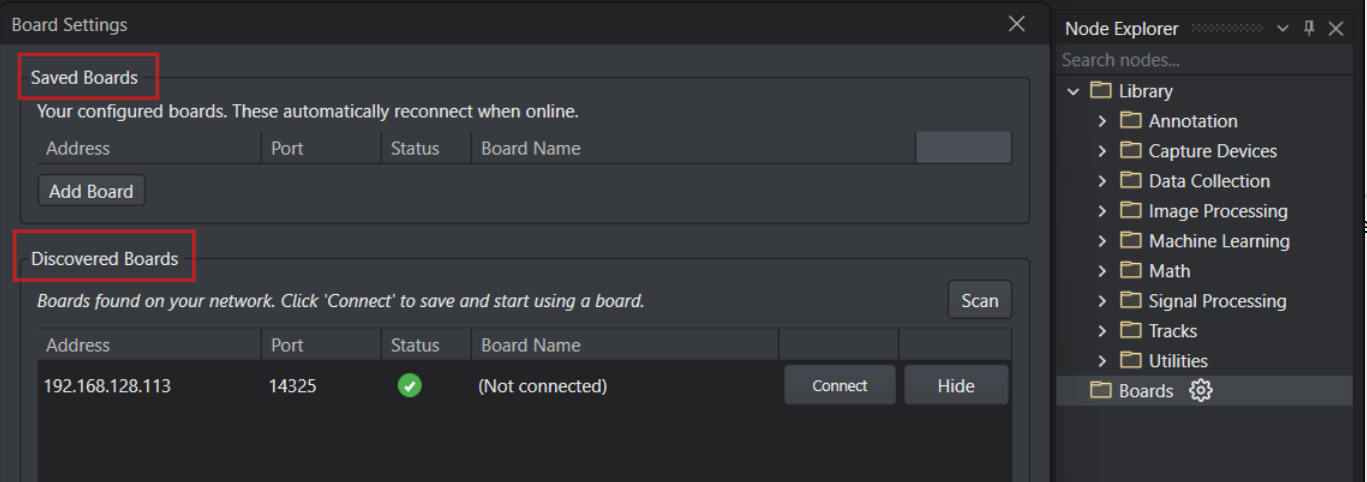
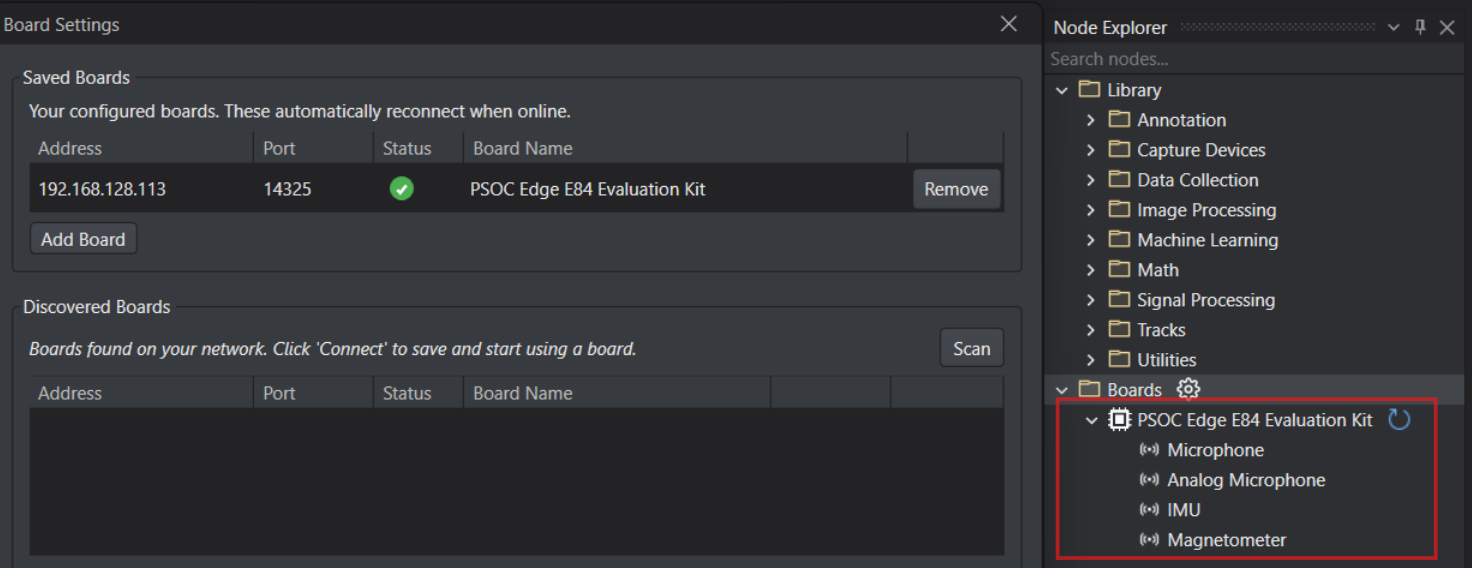
Open DEEPCRAFT Studio> Node Explorer and click the settings icon next to Boards. The Board Settings window appears.
-
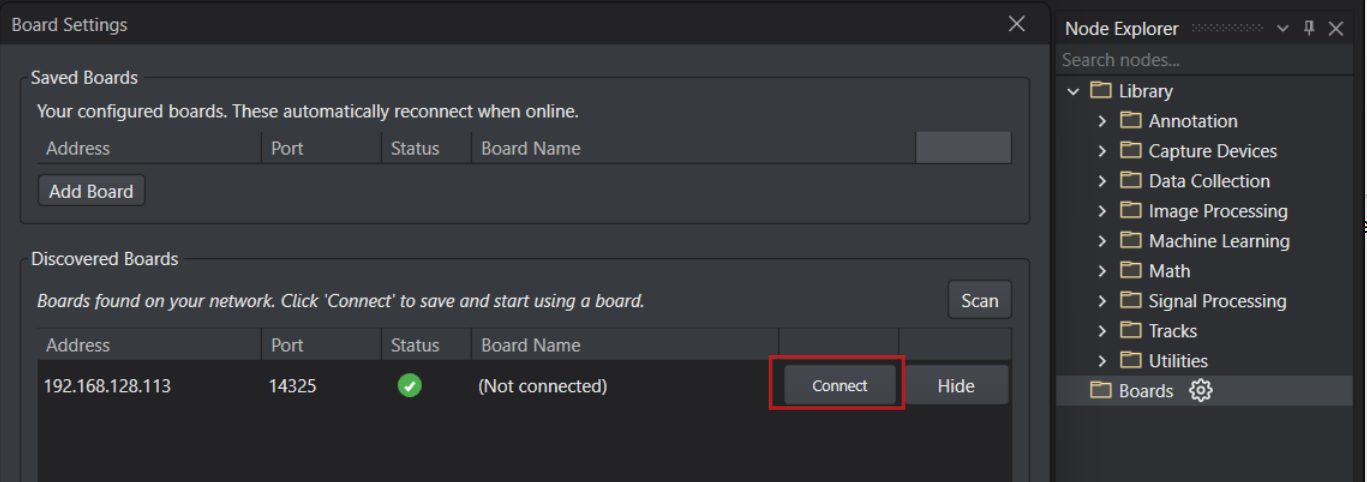
Under Discovered Boards, which displays all the boards available on the Wi‑Fi network, find your board and click Connect. The board now appears under Saved Boards, which displays the boards you can select to stream data into studio. The green icon indicates the board is connected to Wi‑Fi and ready to stream data and the red icon indicates the board is not connected to Wi‑Fi.
If you do not find your board under Discovered Boards, click Scan to discover boards on the network. If the board still does not appear, click Add Board and enter the IP address and port of the board manually.
-
After you connect the board, the board name along with all the sensors present on the board appears under the Boards in the Node Explorer.
-
Unplug the board from the PC/computer and use the external power supply VIN connector (J31) to connect an external DC power supply input to the on-board regulators. The input range for this VIN supply is 7 V to 12 V. Place the board at the target location and start collecting data. To know the detailed steps see Real-Time Data Streaming with PSOC™ Edge E84 Evaluation Kit.
To avoid interruptions or data loss, do not move the PSOC™ Edge E84 Evaluation Kit between multiple Wi‑Fi access points after you start streaming.
-
If multiple boards are visible under Discovered Boards, you can hide the boards that you do not need by clicking the Hide button. The board is placed under the Hidden Boards and can be moved to the discovered boards list by clicking the restore button.
-
If multiple active boards are present under Saved Boards, you can remove the boards you do not need to collect data by clicking the Remove button. The board is placed under the Discovered Boards.
How to collect and label real-time data from the sensors?
Collecting and labeling data in real-time is straightforward using Graph UX in DEEPCRAFT™ Studio. Follow these steps to efficiently collect and label your data:
Step 1: Create Graph UX Project
To create a Graph UX project for data collection, follow the steps:
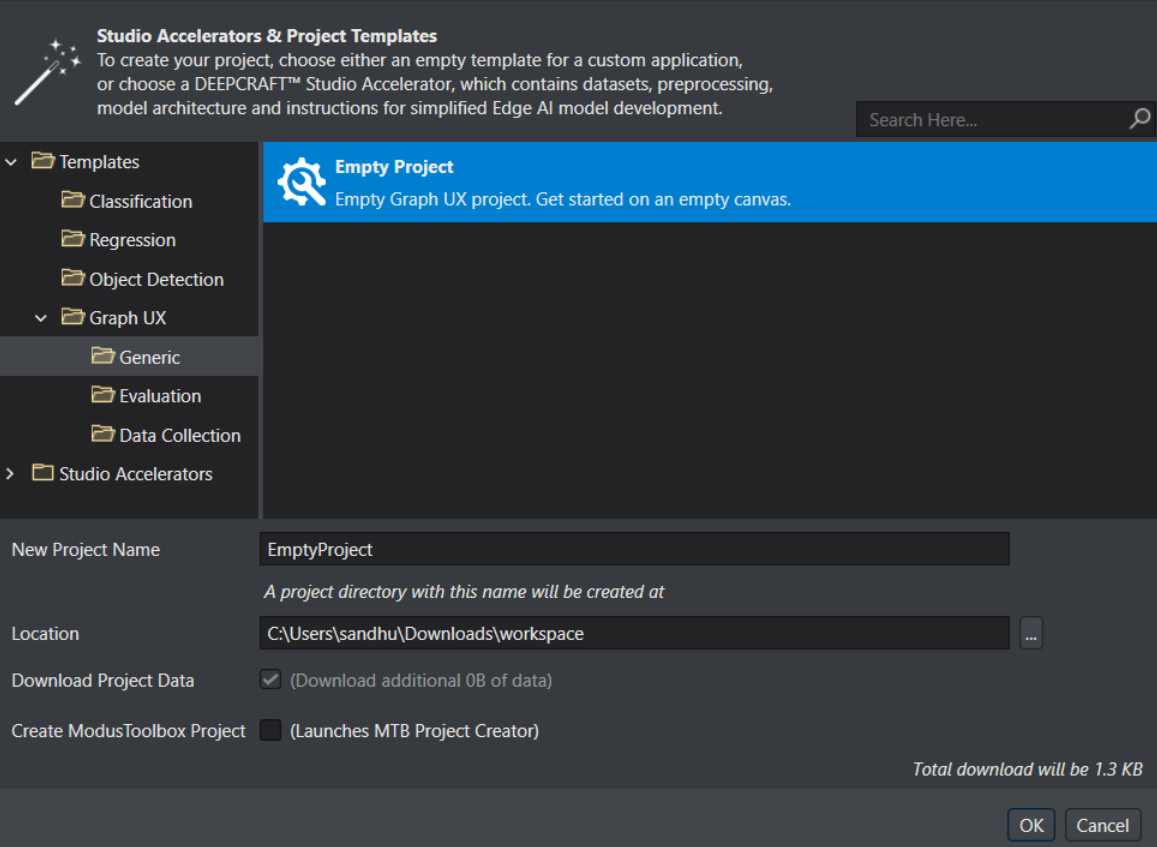
- In DEEPCRAFT™ Studio, navigate to File> New Project. The New Project window appears.
- Expand Templates> Graph UX> Generic and to select Empty project.
- In New Project Name, modify the name of the project, if required.
- In Location, specify the location where you want to save the project directory.
- Click Ok to create the project.
Step 2: Connect PSOC™ Edge E84 Evaluation Kit to PC/laptop
Connect the PSOC™ Edge E84 Evaluation Kit to the laptop or PC through USB connector (J30) using a Type-C USB cable. After connecting the kit, navigate to Node Explorer Window> Boards to check if the board is connected properly. The PSOC™ Edge E84 Evaluation Kit, along with all the sensors is displayed under Boards.
-
If the Node Explorer Window is not open, navigate to View> Node Explorer to access the window.
-
If the PSOC™ Edge E84 Evaluation Kit and sensors are not displayed under Board in Node Explorer, navigate to Tools> Options> Graph UX> Capture Nodes and select Use Node Explorer with Protocol Version 2.
Step 3: Create Data Collection and Data Labeling Graph
To create a simple data-collection and labeling graph, add a sensor to stream data, a data track to visualize and label the stream, and a predefine labels node to define the labels.
1. Select the Sensor node to stream data
The PSOC™ Edge E84 Evaluation Kit consists of various sensors, such as microphone, IMU (accelerometer or gyroscope) and magnetometer. Depending on the type of data you want to collect, select the desired sensor and drag and drop onto the canvas. You can also collect data using multiple sensors simultaneously.
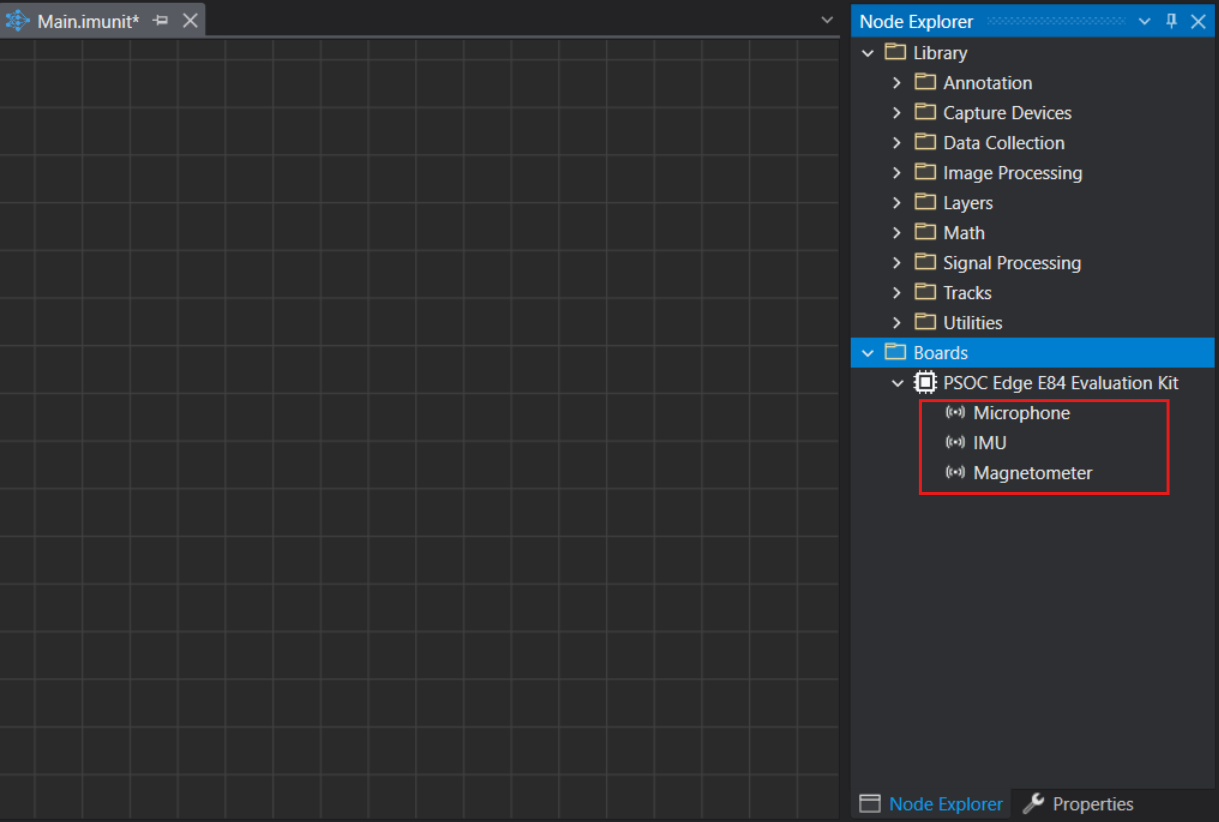
- Microphone node: for streaming audio data
- IMU node: for streaming accelerometer and gyroscope data
- Magnetometer node: for streaming magnetometer data
If you want to stream video data alongside sensor data, you can use the Library> Capture Devices> Local Camera node to stream video using the built-in PC camera. This is particularly useful for labeling data, especially when collecting data from the IMU or other sensors. To know how to set up the Local Camera node, refer to Setting up the Local Camera.
2: Setup the Visualization Tracks
The Visualization Nodes help in visualizing the data collected from the sensor nodes as tracks in the session file.
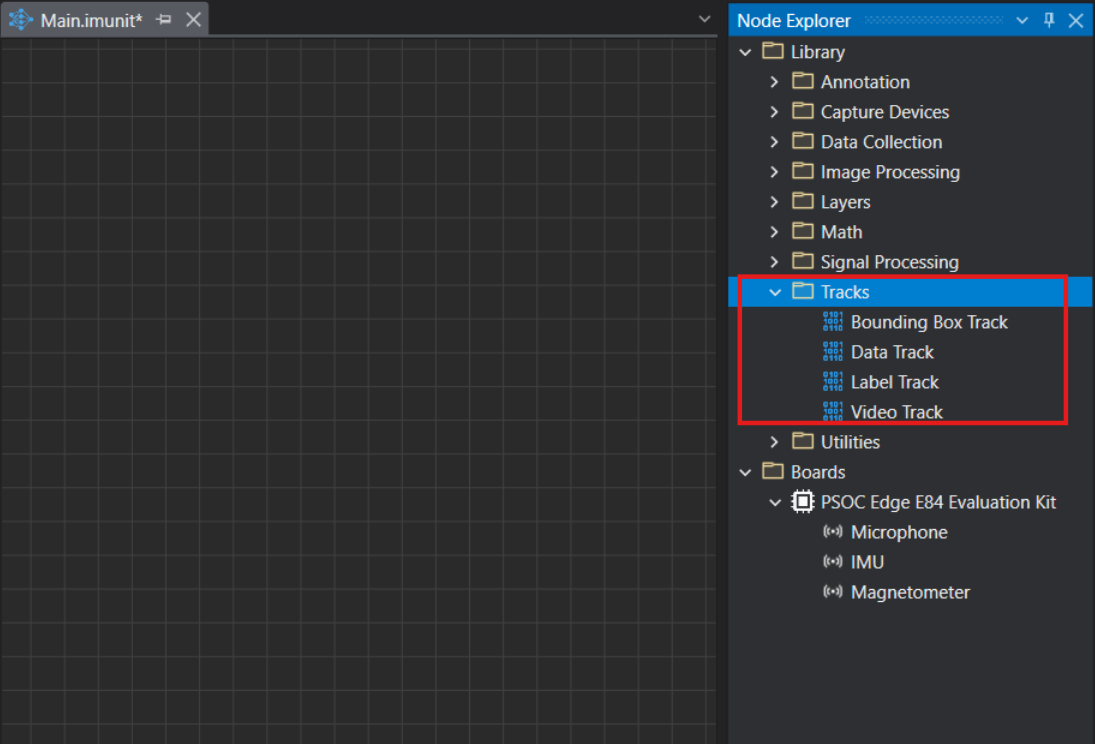
- Data Track: for visualizing and labeling the sensor data collected from Microphone, IMU and Magnetometer.
- Video Track: for visualizing video data collected from the Local Camera node. (Applicable only if you set the Local Camera node to collect video data.)
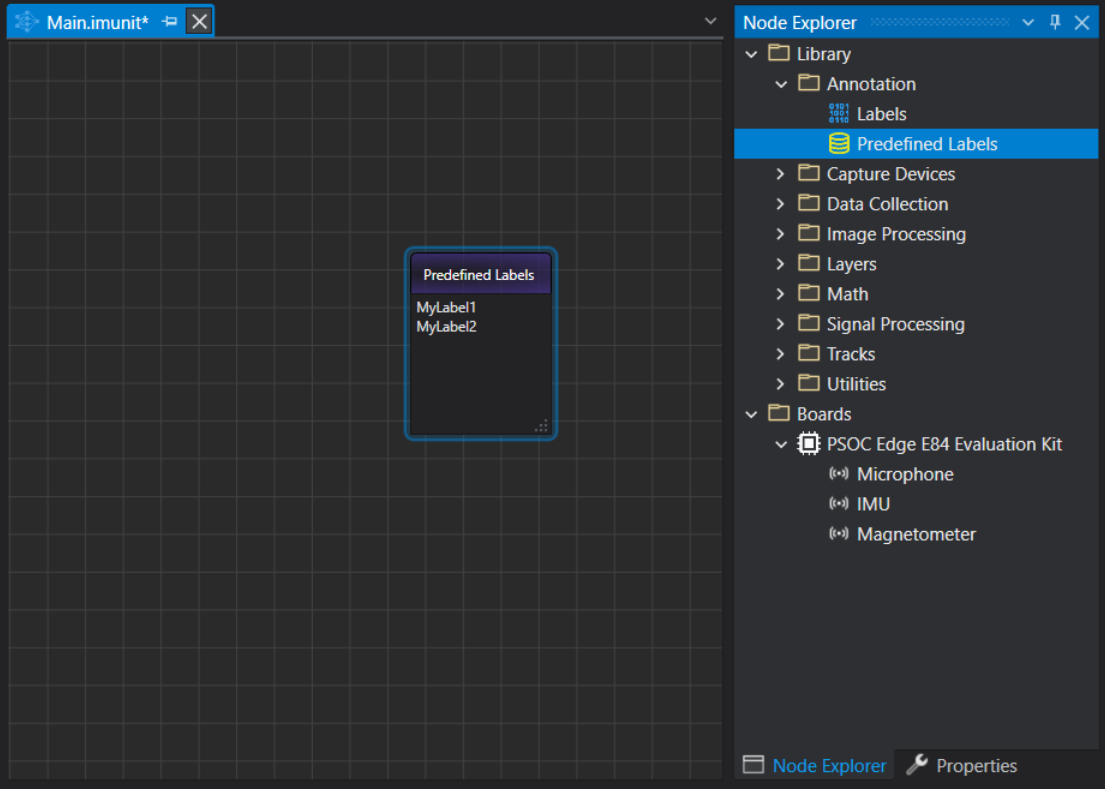
3: Setup the Predefined Labels
Define the classes in the Predefined Labels node for one time and utilize the defined classes to label the data on a click of button.
Depending on the type of data you want to collect and how you plan to collect it, you can create different data collection graphs.
Step 4: Real-time data collection and data labeling
Refer to the topics below for detailed instructions on setting up the sensors and collecting and labeling real-time data:
-
To collect data using the Microphone, connect the Microphone node to the data track. For setting up the microphone node and collecting data using microphone, refer to Collecting and labeling data using Microphone sensor.
-
To collect data using the IMU sensor, connect the IMU node to the data track. For setting up IMU node and collecting data using IMU sensor, refer to Collecting and labeling data using IMU sensor.
-
To collect data using the Magnetometer sensor, connect the Magnetometer node to the data track. For setting up Magnetometer node and collecting data using Magnetometer sensor, refer to Collecting and labeling data using Magnetometer sensor.
You can collect data concurrently from microphone, IMU and magnetometer. Refer to Collecting and Labeling data using multiple sensors to know more.
However, if you want to collect video data along with sensor data, connect the Local Camera to the Video Track in the existing graph. For collecting data using the Local Camera, refer to Setting up the Local Camera.