Collecting and labeling data using Magnetometer sensor
You can collect data from the magnetometer sensor on the PSOC™ 6 AI Evaluation Kit to develop models that can be used to detect geomagnetic field direction and strength sensing. Using the Graph UX functionality, you can collect and label real-time data simultaneously.
After connecting the kit to the PC and creating a Graph UX project, let’s set up the Magnetometer Sensor unit for collecting data and Predefined unit for labeling data on the canvas. Refer to Connecting PSOC™ 6 AI Evaluation Kit to PC/laptop and Creating a Graph UX Project to know the detailed steps.
Setting up the Magnetometer Sensor
-
Expand EmptyProject directory and double-click the Main.imunit to open the canvas.
-
Navigate to the Node Explorer window, expand Boards> PSoC 6 AI (CY8CKIT-062S2-AI) and drag and drop the Magnetometer sensor onto the canvas.
-
Navigate to the Node Explorer window, expand Library> Tracks and drag and drop the Data Track onto the canvas.
-
Click on the red icon in the Magnetometer sensor node and drag over to the red icon in the Data Track node. This creates a connection between the two nodes.
-
Click on the Magnetometer sensor node to edit the settings in the Properties window.
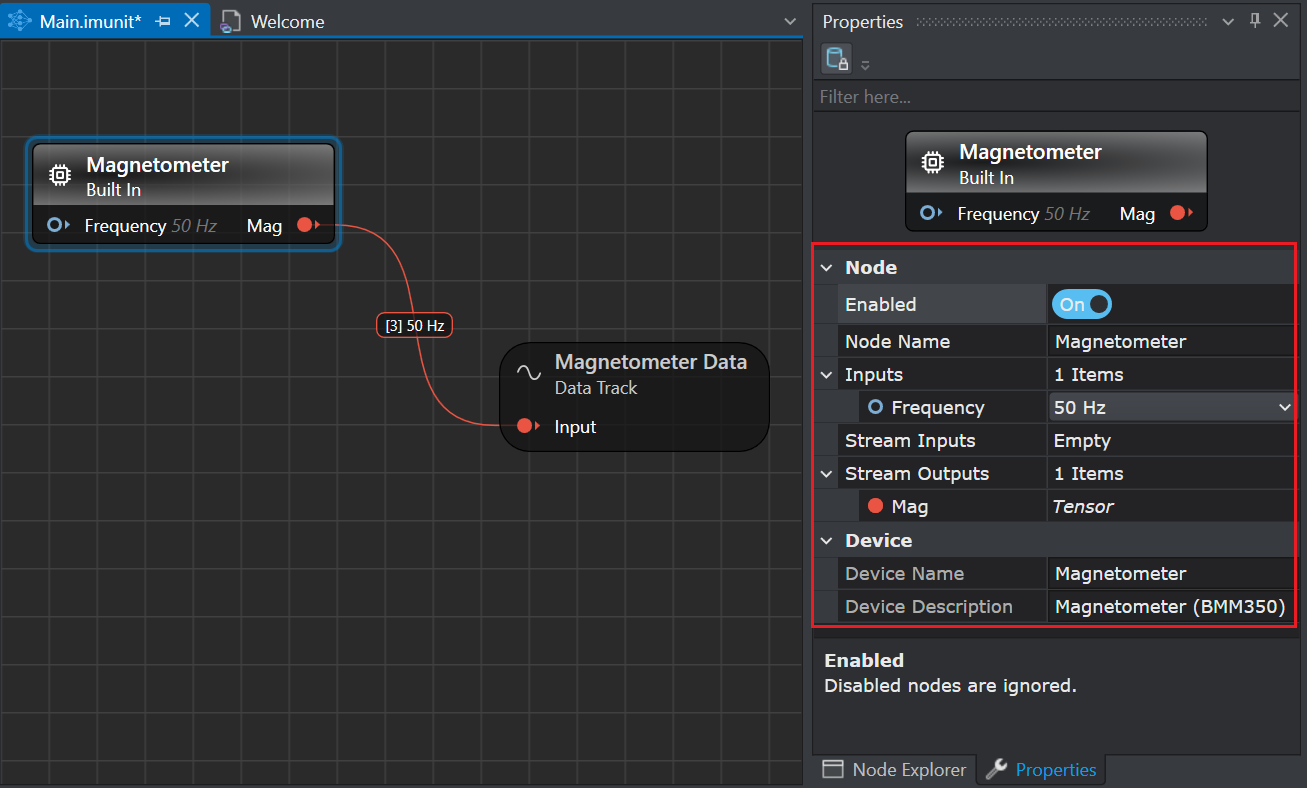
Setting the Properties of Magnetometer Sensor Node
Sensor Node Properties Node Enabled: Turn the radio button ON or OFF to enable or disable the node respectively.
Node Name: Enter the name you want to assign to the node.Inputs Frequency : Select the sampling frequency at which you want to collect data in Studio - 50 Hz, 100 Hz, 200 Hz, or 400 Hz. Stream Outputs Mag: Displays the name of the output stream from the sensor node. Device Device Name: Displays the name of the sensor.
Device Description: Displays the description of the sensor.
After setting up the Magnetometer sensor node, you can utilize the same graph to label the real-time data, by adding a Predefined Labels unit onto the canvas. Define the classes in the Predefined Labels node for one time and utilize the defined classes to label the data on a click of button.
Setting up the Predefined Labels
-
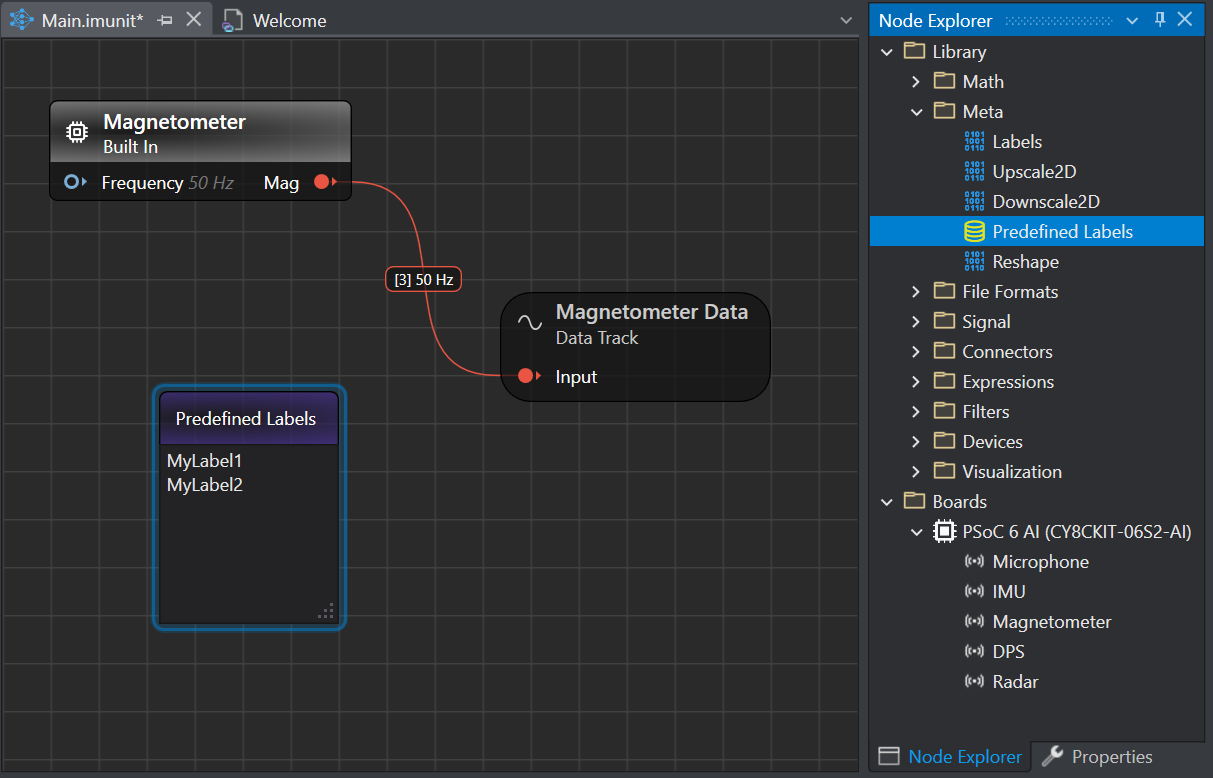
In the Node Explorer window, expand Library > Annotation and drag and drop the Predefined Labels unit onto the canvas. The Predefined Labels unit displays the default classes.
-
Define the classes in Predefined Labels node by entering every class in a new line.
After defining the classes, start collecting and labeling data simultaneously.
Real-time data collection and data labeling
-
Navigate to the toolbar and click the Start button to open the session file (live.imsession). An empty session file opens displaying the pre-defined classes in the Labels bar.
-
Click the Record button to start capturing the real-time data.
-
In the Labels bar, select a class to start adding labels to the streaming data.
-
Deselect the same class to stop adding the labels. Similarly, you can enable or disable the other classes and label the data.
-
Click the Record button to stop collecting the data.
-
Select File > Save to save the session file, data track and label track. The Save New Session window appears.
-
In Location, click the three dot and select the desired location to save the files.
-
In Session Name, enter the name of the session file.
-
Under Track Options, set the following:
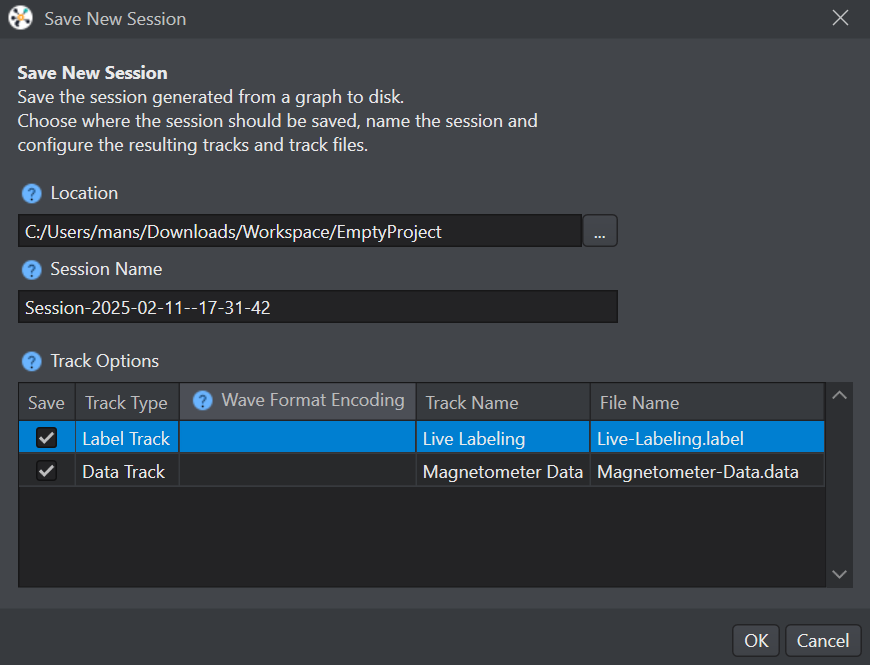
- In Track Name, double-click the column to edit the track name, if required
- In File Name, double-click the columns to edit the track name, if required
-
Select the save checkbox corresponding to the tracks you want to save.
-
Click OK to save the files.
-
Repeat the instructions from step 2 to collect and save data in multiple session files.
After collecting the data, add data to the required project and start with the machine learning workflow in Studio. Refer to Create project and Add data to project to know more.
If you prefer not to collect and label data simultaneously, you can first collect the data. Once the data collection is complete, simply press the play button in the session and begin labeling by selecting the appropriate labels in the Labels bar.