Real-Time Data Collection with PSOC™ 6 AI Evaluation Kit using old streaming firmware
If you have not yet flashed the PSOC™ 6 AI Evaluation Kit with the new streaming firmware, follow the instructions in this topic to stream data into DEEPCRAFT™ Studio. However, we recommend using the new streaming firmware for improved functionality. For detailed instructions on how to flash the firmware, please refer to this section.
If you are collecting data using the PSOC™ 6 AI Evaluation Kit or any other board flashed with old streaming firmware/ Protocol version 1, make sure you select Serial Capture Nodes with Protocol Version 1 option in Tools> Options> General, before collecting data.
You can stream real-time data using the PSOC™ 6 AI Evaluation Kit into DEEPCRAFT™ Studio. You can add additional data to your existing projects or build your own dataset from scratch. You can collect labeled as well as unlabeled data as per your project requirement.
How to collect and label real-time data?
Collecting and labeling data is straightforward using Graph UX in DEEPCRAFT™ Studio. Follow these steps to efficiently collect and label your data:
- Connecting PSOC™ 6 AI Evaluation Kit to the laptop
- Creating a Graph UX Project
- Creating Data Collection and Data Labeling Graph
- Real-time data collection and data labeling
Step 1: Connecting PSOC™ 6 AI Evaluation Kit with laptop
Connect the PSOC™ 6 AI Evaluation Kit to the laptop or PC through PSOC™ 6 USB connector (J2) using a Type-C USB cable.
Step 2: Creating project in DEEPCRAFT™ Studio
You can create an Empty Graph UX Project or Live Data Collection Starter Graph UX Project containing an example graph. Refer to How to get started with Graph UX? for instructions on creating the Graph UX project.
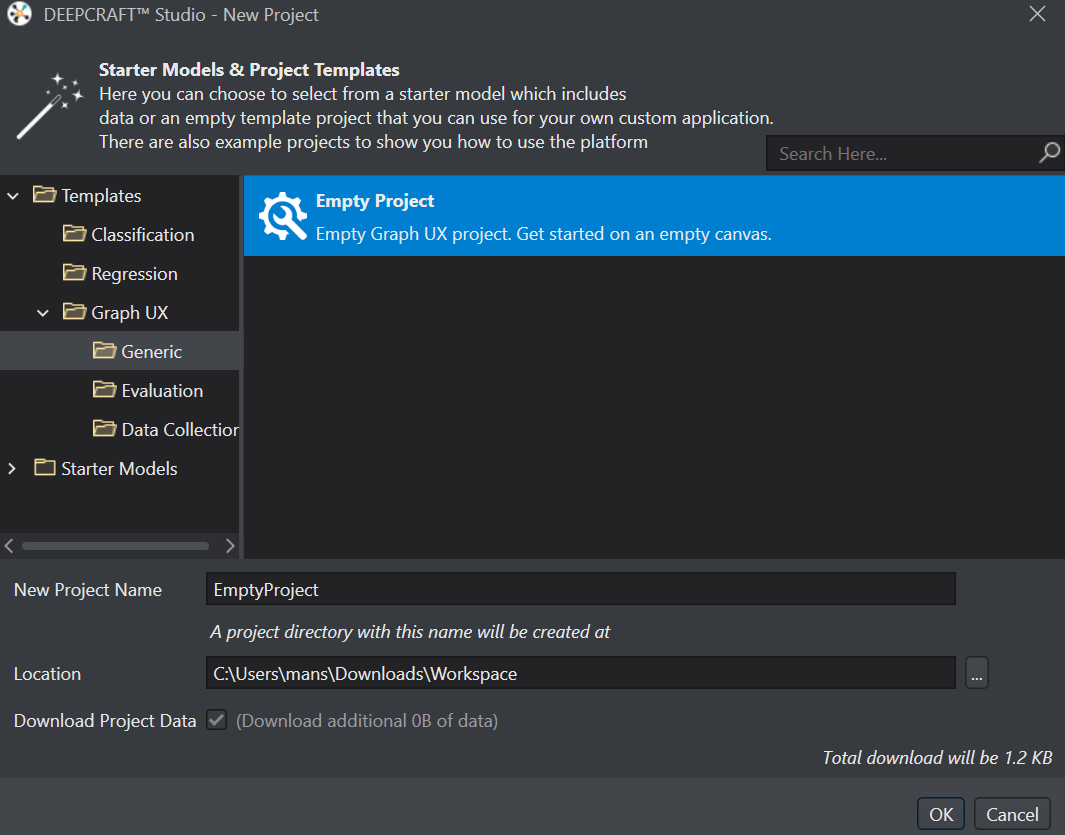
The Live Data Collection Starter Graph UX project contains an example graph for collecting and labeling data using a Local Microphone. So, if you use the Live data Collection starter graph ux project to collect data using other sensons, just replace the Local Microphone node with the desired sensor node. But, if you select the Empty Graph UX project to collect and label data, you need to create the data collection and labeling graph. Follow the steps below to create the data collection graph.
Step 3: Creating Data Collection and Data Labeling Graph
DEEPCRAFT™ Studio provides the functionality to collect and label the real-time data simultaneously. Let’s set up the Serial Capture unit for collecting data and Predefined unit for labeling data on the canvas.
Setting up the Serial Capture
-
Connect the board to the laptop or PC through PSOC™ 6 USB connector (J2) using a Type-C USB cable.
-
Expand EmptyProject directory and double-click the Main.imunit to open the canvas.
-
Navigate to the Node Explorer window, expand Library> Capture Devices and drag and drop the Serial Capture unit onto the canvas.
-
Navigate to the Node Explorer window, expand Library> Tracks and drag and drop the Data Track onto the canvas.
-
Goto Serial Capture > Properties and select USB Serial Device port. To check the COM port at which the board is connected, open Device Manager > Ports and look for USB Serial Device.
-
Click on the red icon in the Serial Capture node and drag over to the gray icon in the Data Track node. This creates a connection between the two nodes.
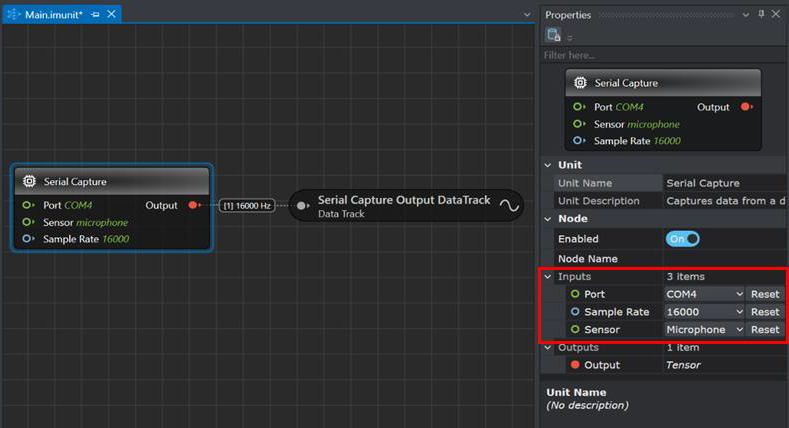
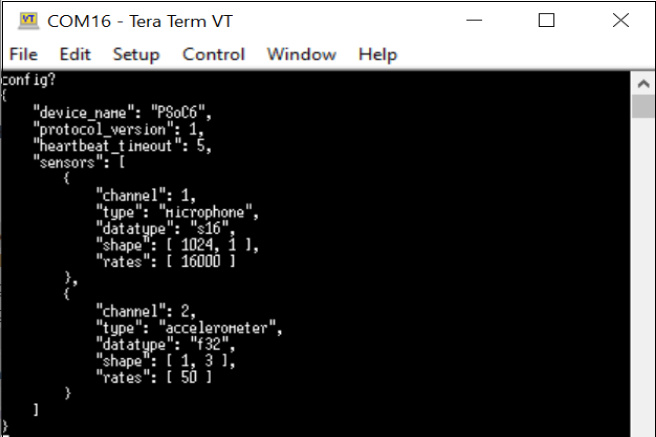
- The microphone collects data at a sampling rate of 16000 and an accelerometer collects data at a sampling rate of 50.
- The connection might not establish if the COM port is already in use in DEEPCRAFT™ Studio or another tool.
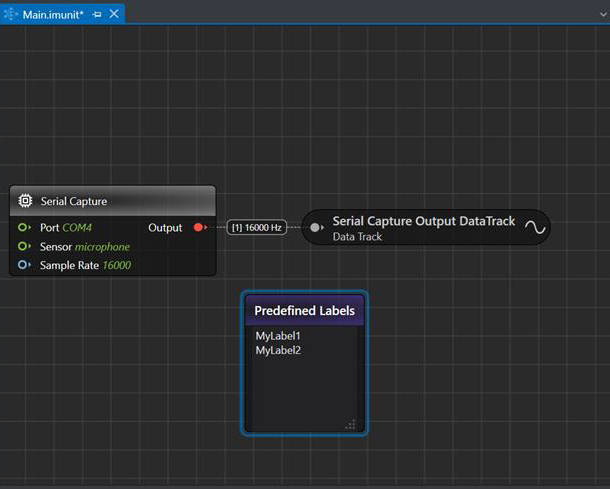
After setting up the Serial Capture, you can utilize the same graph to label the real-time data, by adding a Predefined Labels unit onto the canvas. Define the classes in the Predefined Labels node for one time and utilize the defined classes to label the data on a click of button.
Setting up the Predefined Labels
-
Navigate to the Node Explorer window, expand Library> Annotation and drag and drop the Predefined Labels unit onto the canvas. The Predefined Labels unit displays the default classes.
-
Define the classes in Predefined Labels node by entering every class in a new line.
After defining the classes, start collecting and labeling data simultaneously.
Step 4: Real-time data collection and data labeling
-
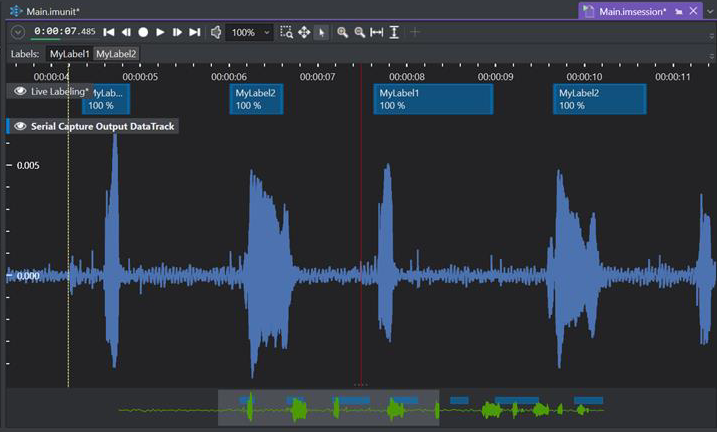
Navigate to the toolbar and click the Start button to open the session file (main.imsession). An empty session file opens displaying the pre-defined classes in the Labels bar.
-
Click the Record button to start capturing the real-time data.
-
In the Labels bar, select a class to start adding labels to the streaming data.
-
Deselect the same class to stop adding the labels. Similarly, you can enable or disable the other classes and label the data.
-
Click the Record button to stop collecting the data.
-
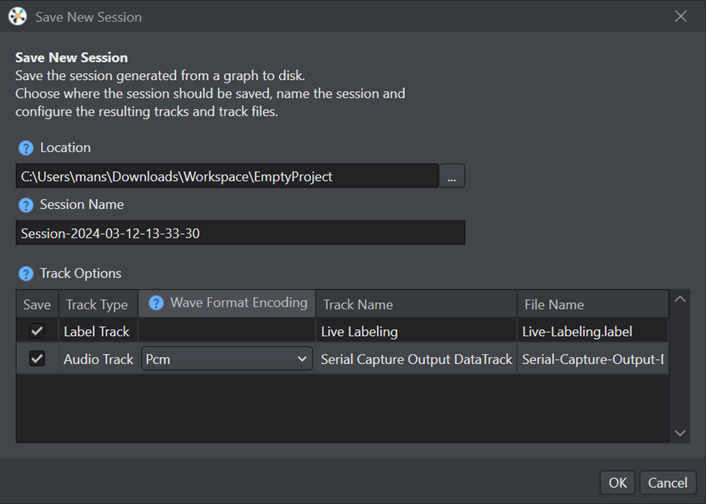
Select File > Save to save the session file, data track and label track. The Save New Session window appears.
-
In Location, click the three dot and select the desired location to save the files.
-
In Session Name, enter the name of the session file.
-
Under Track Options, set the following:
- In Wave Format Encoding, select the encoding format for the audio tracks
- In Track Name, double-click the column to edit the track name, if required
- In File Name, double-click the columns to edit the track name, if required
-
Select the save checkbox corresponding to the tracks you want to save.
-
Click OK to save the files.
-
Repeat the instructions from step 2 to collect and save data in multiple session files.
After collecting the data, add data to the required project and start with the machine learning workflow in Studio. Refer to Create project and Add data to project to know more.
Testing OOB application with serial terminal
-
Connect the board to the PC through PSOC™ 6 USB connector (J2) using a Type-C USB cable. This enables a serial port for sensor data collection.
-
Ensure that the power LED (D1) turns ON, indicating the board is powered.
-
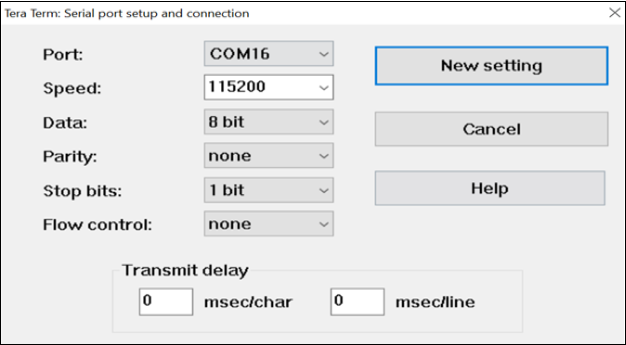
In the terminal application, open the serial connection to the device. It should present itself as USB serial device. Connect to this port with the following settings:
- Baud rate: 115200
- Data: 8 bit
- Parity: None
- Stop bit: 1 bit
- Flow control: None
-
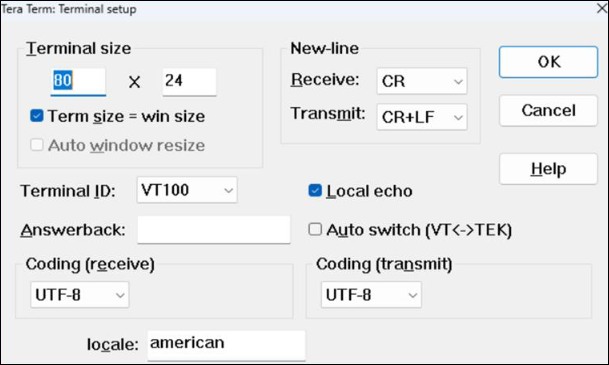
Set the terminal settings as follows:
- Newlines should be transmitted as CR+LF
- Enable local echo
-
Type config? and press Enter key (to send CR+LF) and verify that the device responds with a JSON structure describing the protocol configuration.
-
Type subscribe,1,16000 and verify that the device streams audio data. Notice that sample collection stops after 5 seconds. The garbled text on the terminal is the audio data.
-
Type subscribe,2,50 and verify that the device streams IMU data. Notice that sample collection stops after 5 seconds. The garbled text on the terminal is the IMU data.
Currently backspace is not supported in terminal commands. If you encounter issues such as being unable to see commands on the terminal or receiving unknown command errors, follow the steps below:
- Reset the terminal and clear the buffer.
- Reset board to ensure a fresh execution.