Collecting and Labeling data using multiple sensors
Using the PSOC™ 6 AI Evaluation Kit, you can collect data from multiple sensors simultaneously. Depending on the type of data required for your machine learning problem, you can create a graph to collect data from multiple sensors accordingly. Here are some scenarios where you may want to collect data from different sensors simultaneously, for instance, building Activity Recognition and Motion Tracking model for wearable devices, that can monitor the physical activities for fitness and health applications or building Navigation Systems model that can provide precise motion tracking and orientation data to improve navigation systems.
To address these use cases, you can use the IMU sensor (accelerometer and gyroscope) to measure the linear acceleration and angular velocity along the X, Y, and Z axis respectively and Magnetometer sensor to measure the magnetic field strength along the X, Y, and Z axes, providing orientation data.
We will walk you through the process of creating a graph for collecting data from IMU (accelerometer and gyroscope) and magnetometer simultaneously. Additionally, we will show you how to pre-define the labels for real-time and collecting video data using Local Camera, which will facilitate the labeling of sensor data.
You can collect data concurrently from microphone, IMU, magnetometer, and pressure sensor. However, you must collect data from Radar sensor independently, without concurrent data collection from any other sensors.
Understanding the Graph Flow
Before we start plotting the graph, it’s crucial to understand the components we will use and their significance. For instance, comprehending the concept of output shape from IMU and Magnetometer is essential before we begin.
Output Shape from an IMU node
-
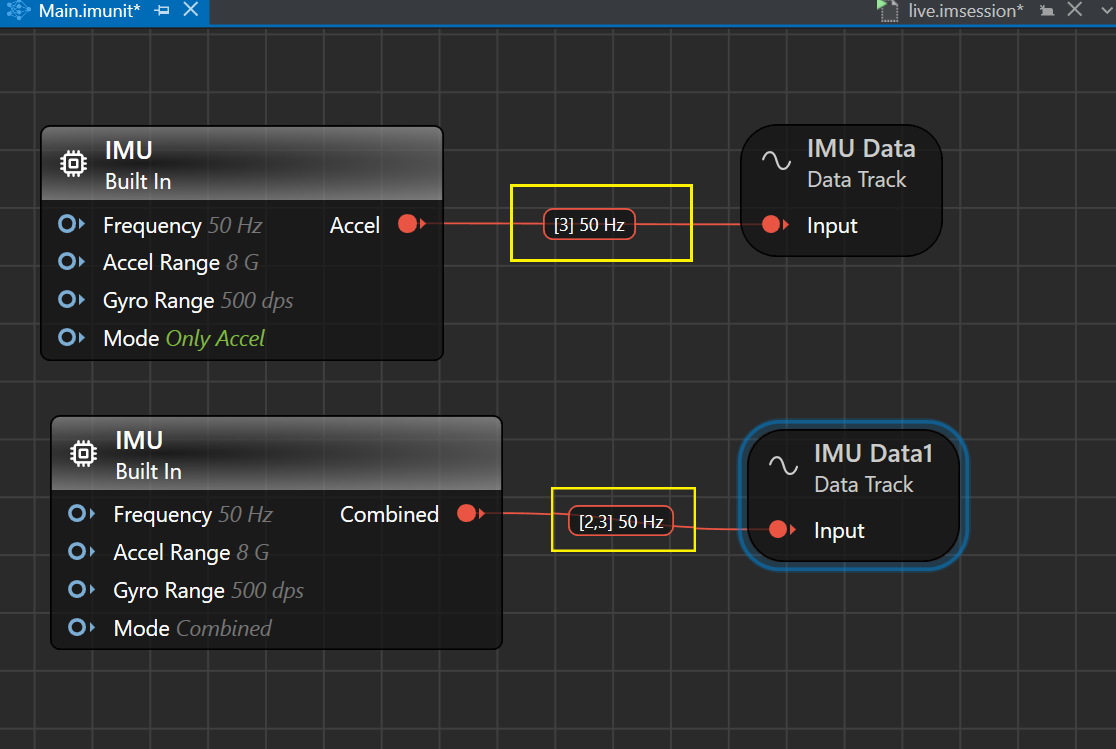
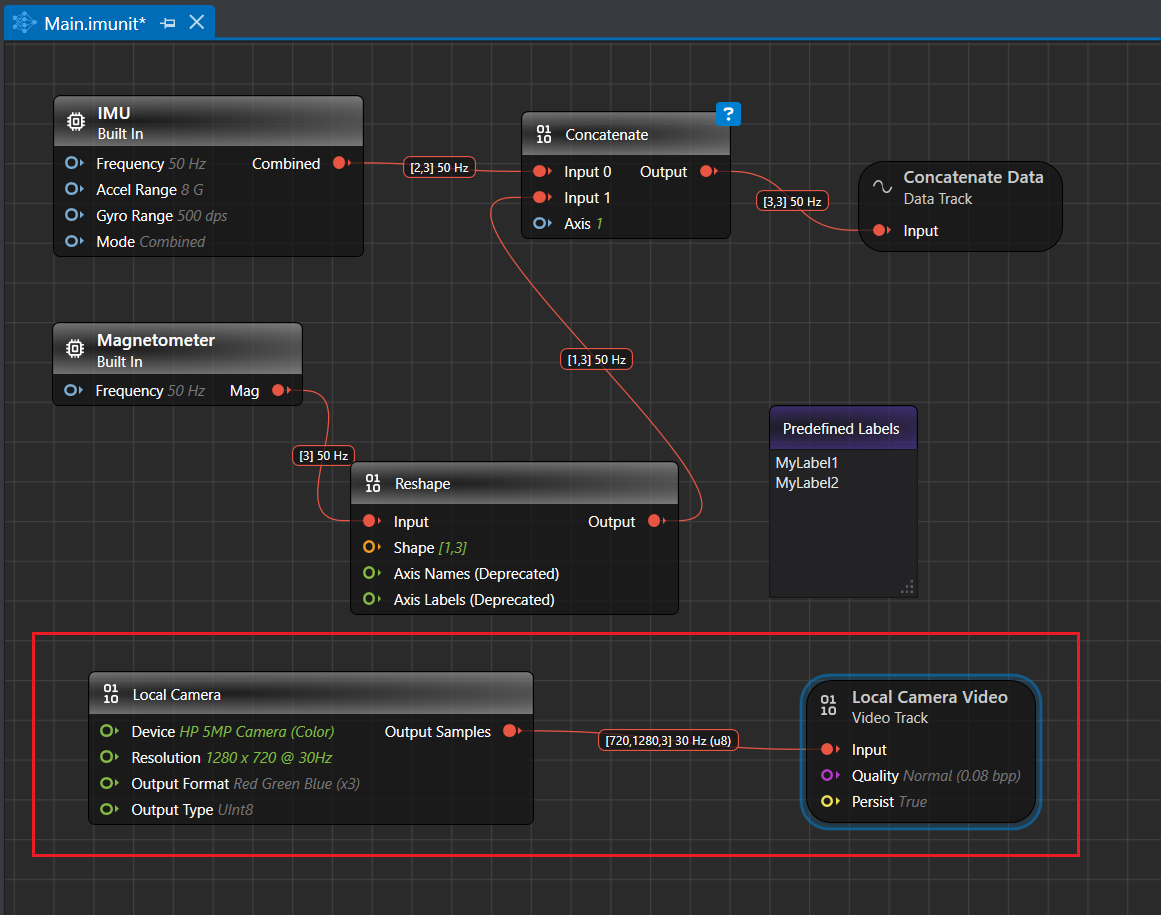
If Mode option is set as Split, accel only, gyro only, in either case, only one sensor (accelerometer or gyroscope) is used to collect data, resulting in a one-dimensional output shape. For instance, in this case, the output shape is ([3],50 Hz), where 3 represents the three axes (X, Y, and Z) for sensor and 50 Hz is the sampling frequency.
-
If Mode option is set as Combined, both accelerometer and gyroscope are used to collect data, resulting in a two-dimensional output shape. For instance, in this case, the output shape is ([2,3]50 Hz), where 2 represents the number of sensors (accelerometer and gyroscope), 3 represents the three axes (X, Y, and Z) for each sensor and 50 Hz is the sampling frequency.
Output Shape from Magnetometer node
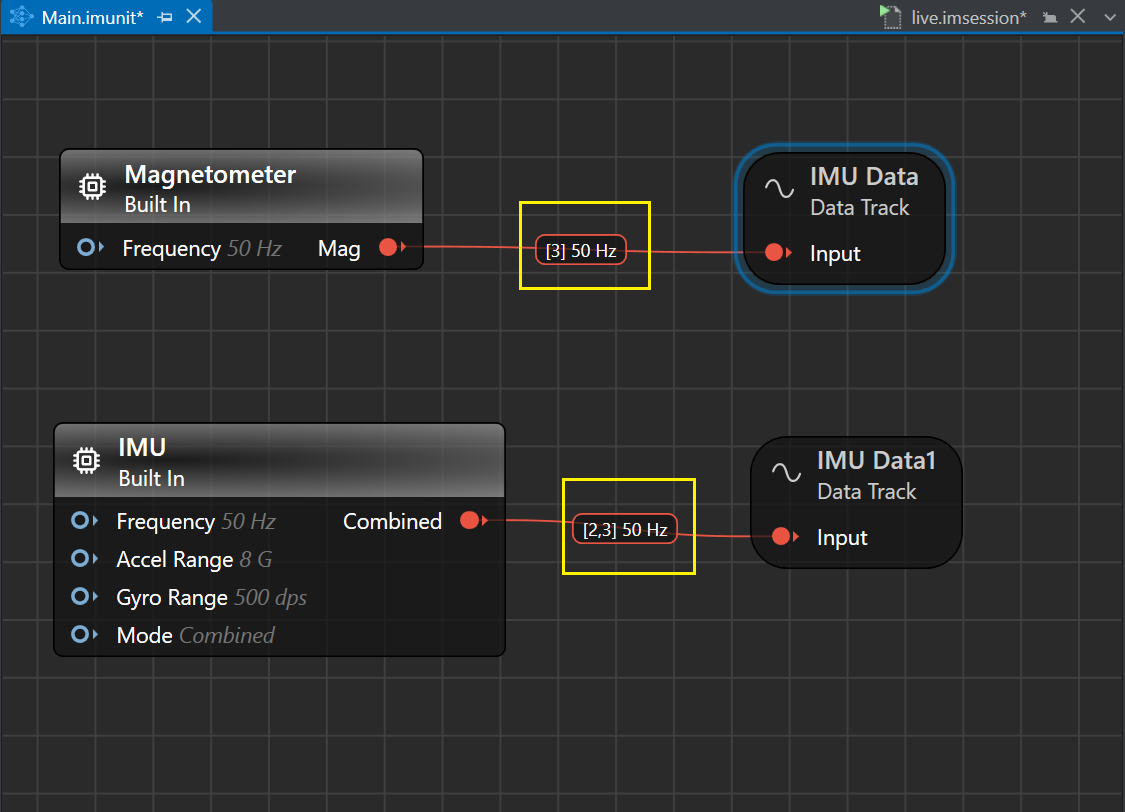
When collecting data from magnetometer, the output shape is initially one-dimensional. For instance, in this case, the output shape is ([3],50 Hz), where 3 represents the three axes (X, Y, and Z) for magnetometer and 50 Hz is the sampling frequency.
However, since we aim to collect data from all three sensors (accelerometer, gyroscope and magnetometer), we need to convert the output shape from magnetometer from one-dimensional to two-dimensional. To achieve this, we will use the Reshape unit. Additionally, to combine the data from all sensors into a single data track, we will use the Concatenate unit.
How to collect and label real-time data from IMU and Magnetometer?
After connecting the kit to the PC and creating a Graph UX project, let’s set up the sensors for data collection and Predefined unit for data labeling on the canvas. Refer to Connecting PSOC™ 6 AI Evaluation Kit to PC/laptop and Creating a Graph UX Project to know the detailed steps.
Step 1: Creating Data Collection and Data Labeling Graph
-
Expand EmptyProject directory and double-click the Main.imunit to open the canvas.
-
Navigate to the Node Explorer window, expand Boards> PSoC 6 AI (CY8CKIT-062S2-AI) and drag and drop the IMU sensor onto the canvas. Click on the IMU sensor node and set the frequency, accel range, gyro range and mode in the Properties window. In this example, we want to collect data from both accelerometer and magnetometer, so select the mode option as combined. To know more, refer to Setting up the IMU Sensor
-
Navigate to the Node Explorer window, expand Boards> PSoC 6 AI (CY8CKIT-062S2-AI) and drag and drop the Magnetometer sensor onto the canvas. Click on the Magnetometer sensor node and set the frequency in the Properties window.
-
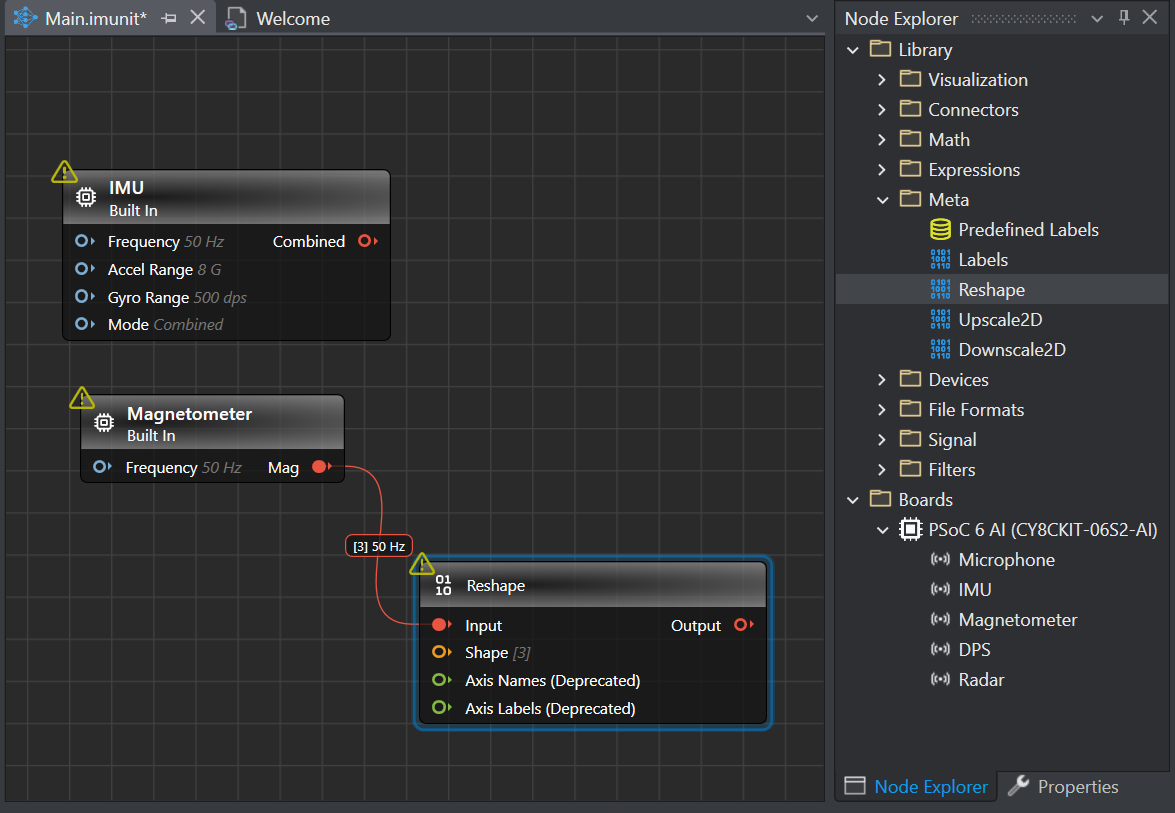
Navigate to the Node Explorer window, expand Library> Math> Slicing and Shaping and drag and drop the Reshape onto the canvas. Click on the red icon in the Magnetometer node and drag over to connect the Input connector in the Reshape node. This creates a connection between the two nodes.
-
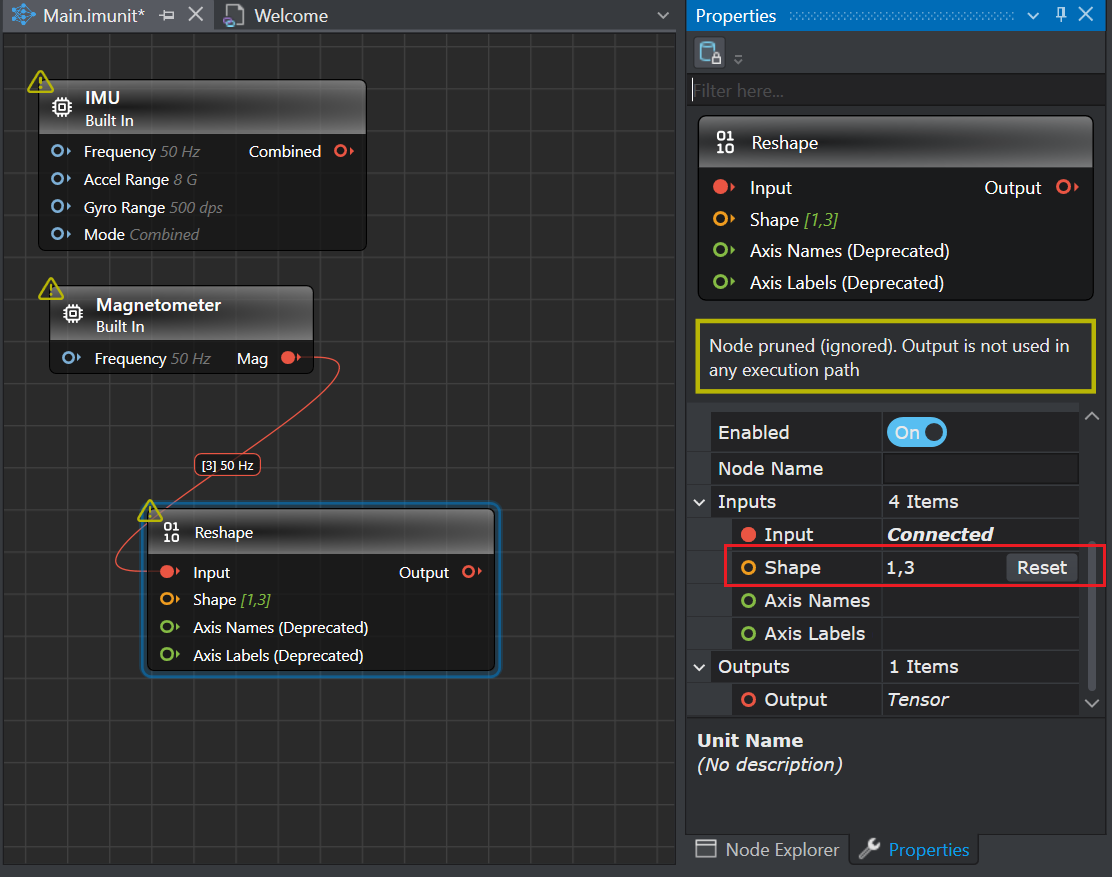
Click the Reshape node to open the Properties window. In Shape parameter, enter [1,3] this will make the output shape of magnetometer from one dimensional to two dimensional.
-
Navigate to the Node Explorer window, expand Library> Math> Slicing and Shaping and drag and drop the Concatenate unit onto the canvas.
-
Click on the output connector (red icon) in the Magnetometer node and drag over to connect one of the Input connectors (red icon) in the Concatenate node.
-
Click on the output connector (red icon) in the IMU node and drag over to connect the other Input connectors (red icon) in the Concatenate node.
-
Click the Concatenate node, to set the axis along which the arrays [2,3] and [1,3] should be joined. When the axis parameter is set to 0, the shape on axis-0 becomes 6 but the shape on axis-1 is not same, leading to errors. Instead, if the axis parameter is set to 1, the shape on the axis-1 becomes 3 and the shape on axis-0 is same.
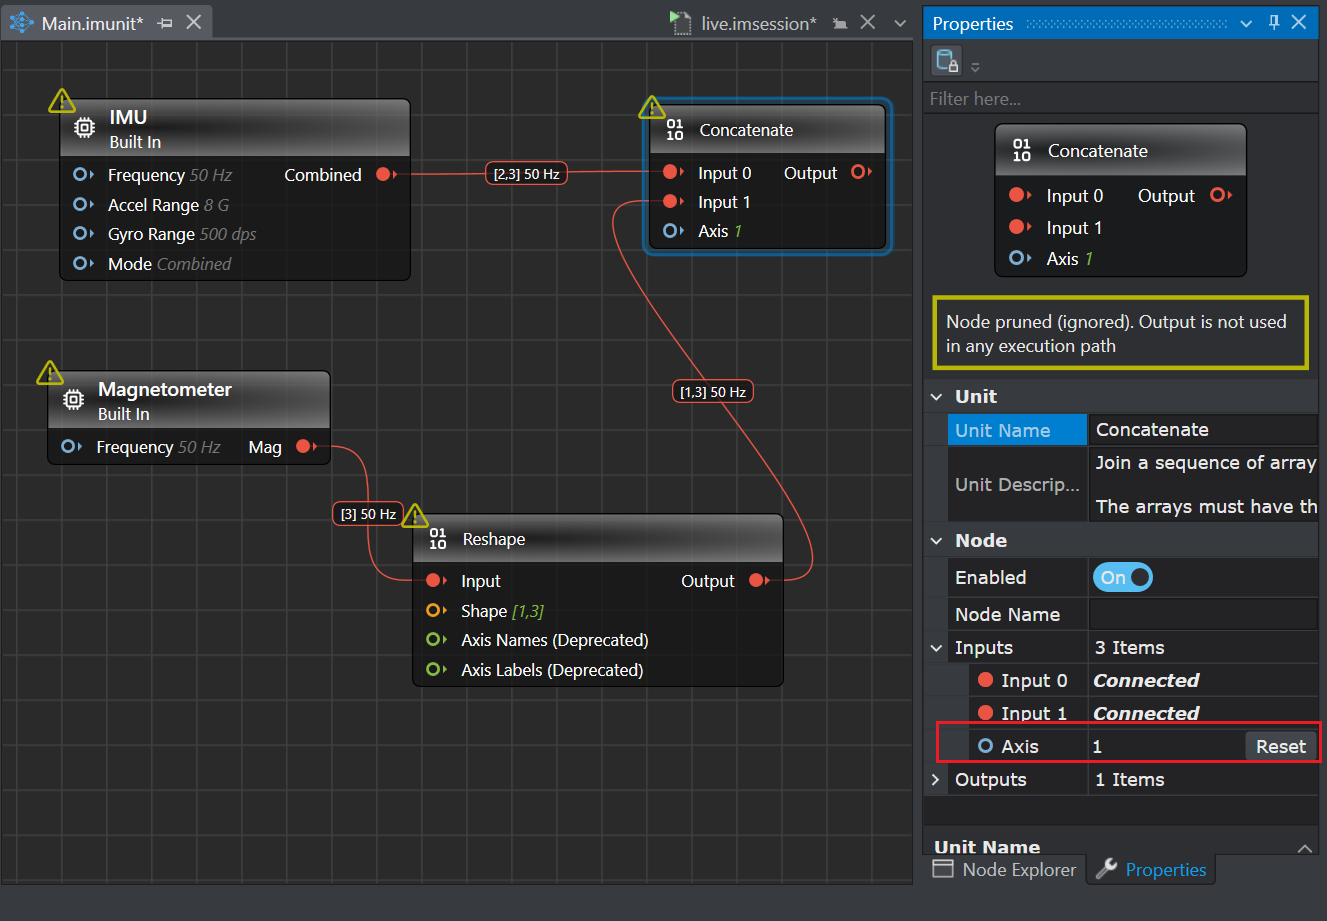
Note: The arrays must have the same shape, except in the dimension corresponding to axis. The axis are defined from right to left, so for array [1,3], 3 is at axis-0 and 1 is at axis-1.
-
Navigate to the Node Explorer window, expand Library> Tracks and drag and drop the Data Track unit onto the canvas.
-
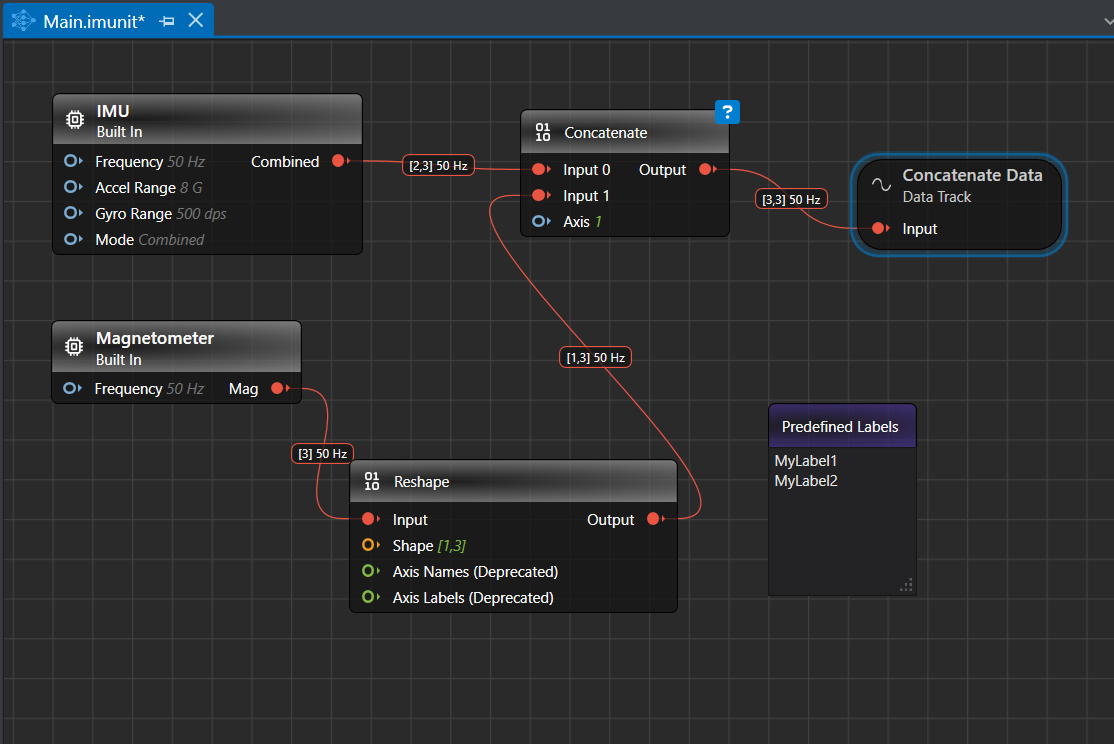
Click on the red icon in the Concatenate node and drag over to the red icon in the Data Track node. This creates a connection between the two nodes.

After setting up the graph for collecting the data from IMU and magnetometer sensor node, you can utilize the same graph to label the real-time data and collect the video data using Local Camera.
Setting up the Predefined Labels
-
Navigate to the Node Explorer window, expand Library> Annotation and drag and drop the Predefined Labels unit onto the canvas. The Predefined Labels unit displays the default classes.
-
Define the classes in Predefined Labels node by entering every class in a new line.
After defining the classes, you can start collecting and labeling data simultaneously. You can also set the Local Camera to collect the video data along with the sensor data. You can use the video to label the sensor data. Setting up Local Camera for collecting video data is an optional step, you can skip and start with real-time data collection.
Setting up the Local Camera
To set up the Local Camera, follow the steps:
-
Connect a camera or use the built-in camera of the laptop or PC.
-
Double-click the Main.imunit file to open the canvas.
-
Navigate to Node Explorer window and expand Library> Capture Devices and drag and drop the Local Camera unit onto the canvas.
The tabs represents the default properties of the local camera:
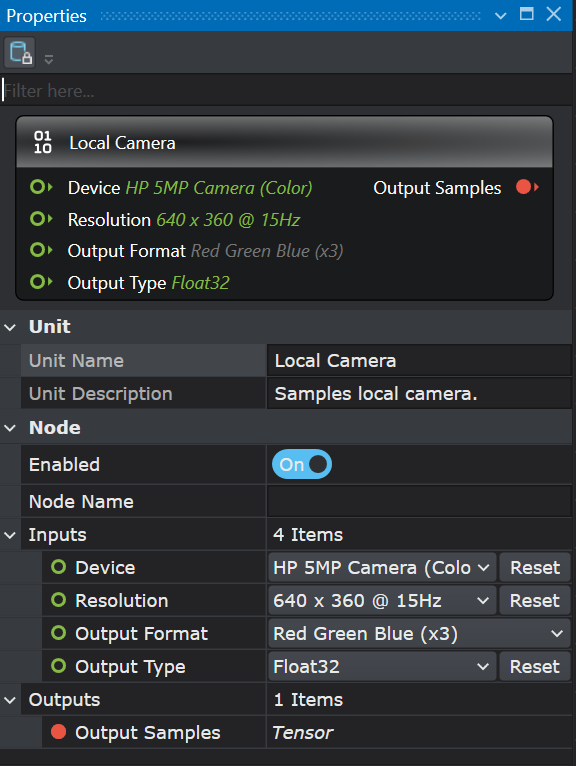
Unit
Unit Name : Displays the name of the unit
Unit Description : Displays the description of the unit -
Navigate to Node Explorer window and expand Library> Visualization and drag and drop the Video Track unit onto the canvas.
The tabs represents the default properties of the video track:
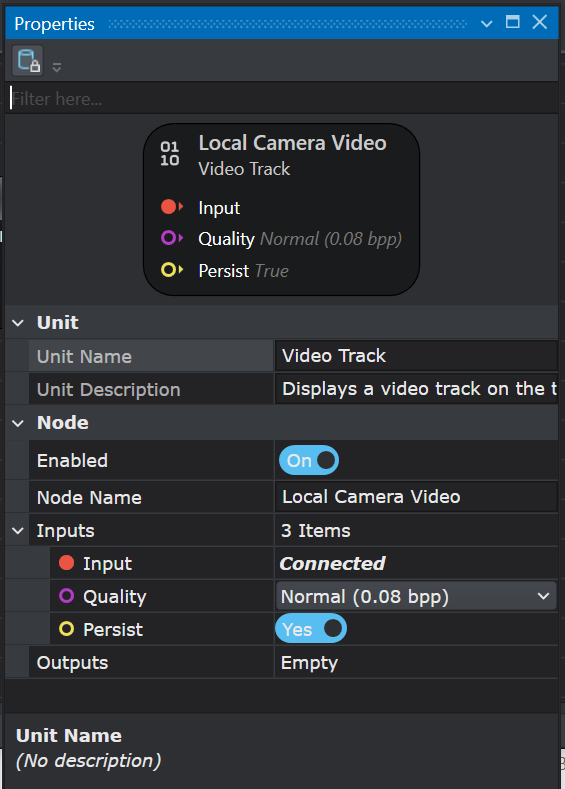
Unit
Unit Name : Displays the name of the unit
Unit Description : Displays the description of the unit
Disabling the Persist option enables real-time video streaming without saving the footage. As a result, replaying or rewinding the video will not be possible. This configuration is optimal for real-time model evaluation when video storage is not required.
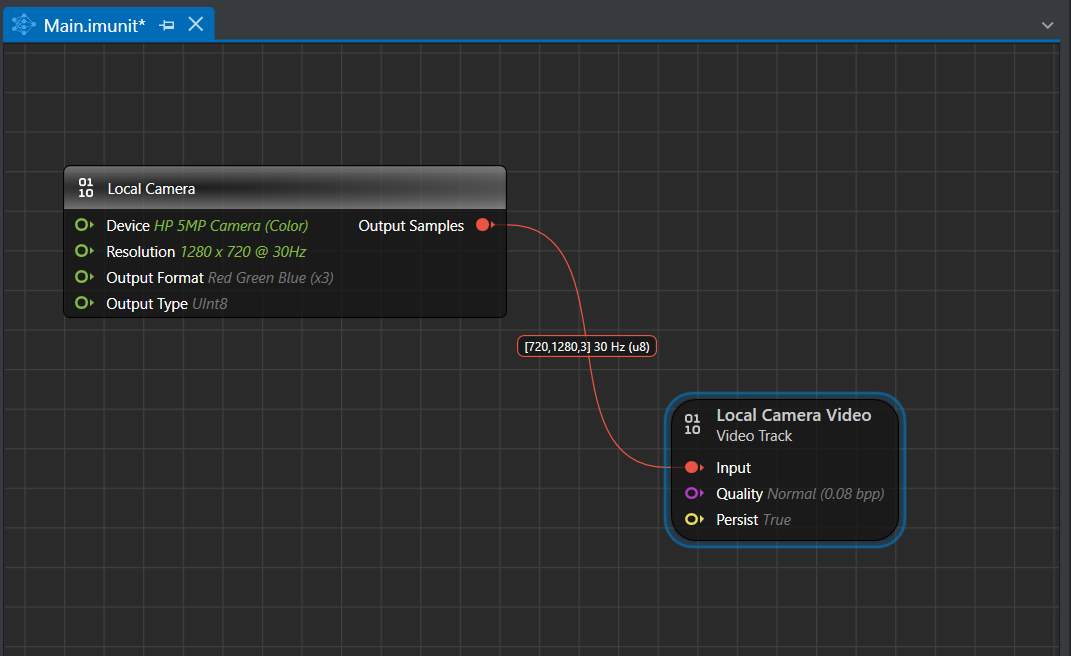
- Connect the Output of the Local Camera Node to the Input of the Video Track by clicking on the red icon in the Local Camera node and dragging over to the red icon in the Video Track. This creates a connection between the two nodes.
Real-time data collection
After illustrating the graph for collecting and labeling data accordingly, follow the steps to capture the real-time data:
-
Navigate to the toolbar and click the Start button to open the (live.imsession) file. An empty session file opens displaying the pre-defined classes in the Labels bar.
-
Click the Record button to start the recording.
-
Capture the real-time data for few seconds.
-
Click the Record button to stop the recording.
-
Select File>Save Main.session As, if you only want to the save the session file. However, select File>Save to save the session file as well the data track. The Save New Session window appears.
-
In Location, click the three dot and select the desired location to save the file.
-
In Session Name, enter the name of the session file.
-
Under Track Options, you can set the followings:
• In Track Name, double-click the column to edit the track name, if required.
• In File Name, double-click the columns to edit the track name, if required. -
Select the save checkbox corresponding to the tracks you want to save.
-
Click OK to save the files.
-
Repeat the instructions from step 2 to collect and save data in multiple session files.
This is an example of how to collect data from two sensors simultaneously. Similarly, based on the type of data you need to collect, you can create a graph to collect data from different sensors at the same time.