Predicting Power Generation from Wind Turbine
As the world shifts from non-renewable to renewable energy sources, wind energy emerges as a promising solution. However, its unpredictability poses a significant challenge. A wind turbine converts the kinetic energy of the wind into mechanical energy via a shaft, which is then transformed into electrical energy through a generator. The power generated by a wind turbine is influenced not only by wind speed but also by various atmospheric and technical conditions. To address this problem, we aim to develop a regression model that can predict the power generated by a wind turbine.
Objective
In this tutorial, we will walk you through the process of building a regression model that can predict the power generation from a wind turbine using Studio.
The original data is sourced from Kaggle platform . We cleaned and organized the data through several steps, including interpolating missing values, removing rows with missing values, selecting relevant features, normalizing feature data, and partitioning the data into blocks. The processed data is then used to build the machine learning model.
Downloading the Starter Project
Begin with creating a project in Studio and select Regression> Generic> Power Generation Prediction as the project type. To know how to create a project, refer to Creating a project.
Understanding the Data
The project directory contains the following sub-folders, tools and resources:
- Data folder: contains the sample data
- Models folder: contains the trained model (.h5 Tensorflow model) and edge code ( neural network model and preprocessor translated to C code) ready for integration into the embedded firmware
- Readme.md file: describes the project and data in detail
- Project file: contains the necessary resources to build the machine learning model
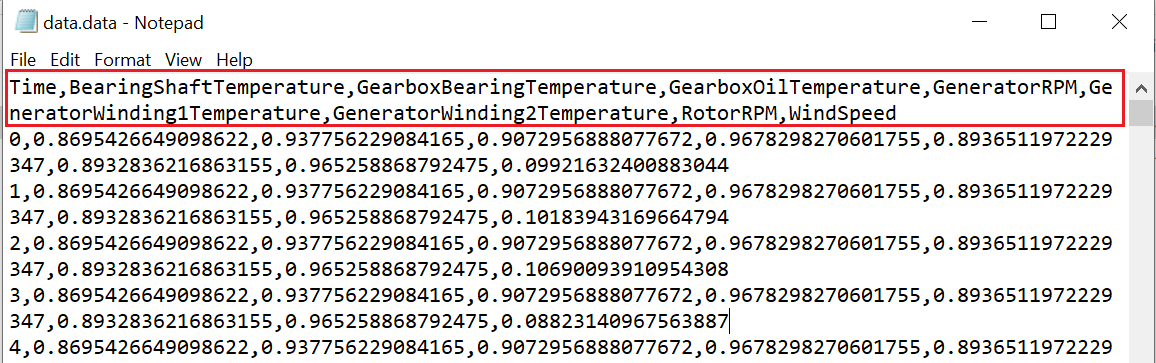
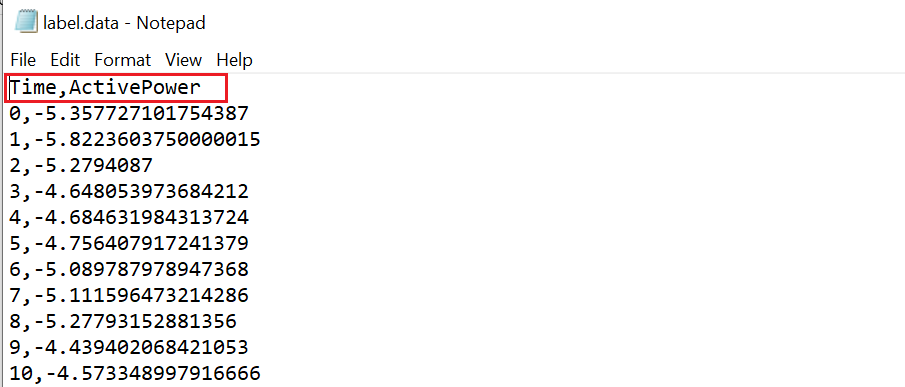
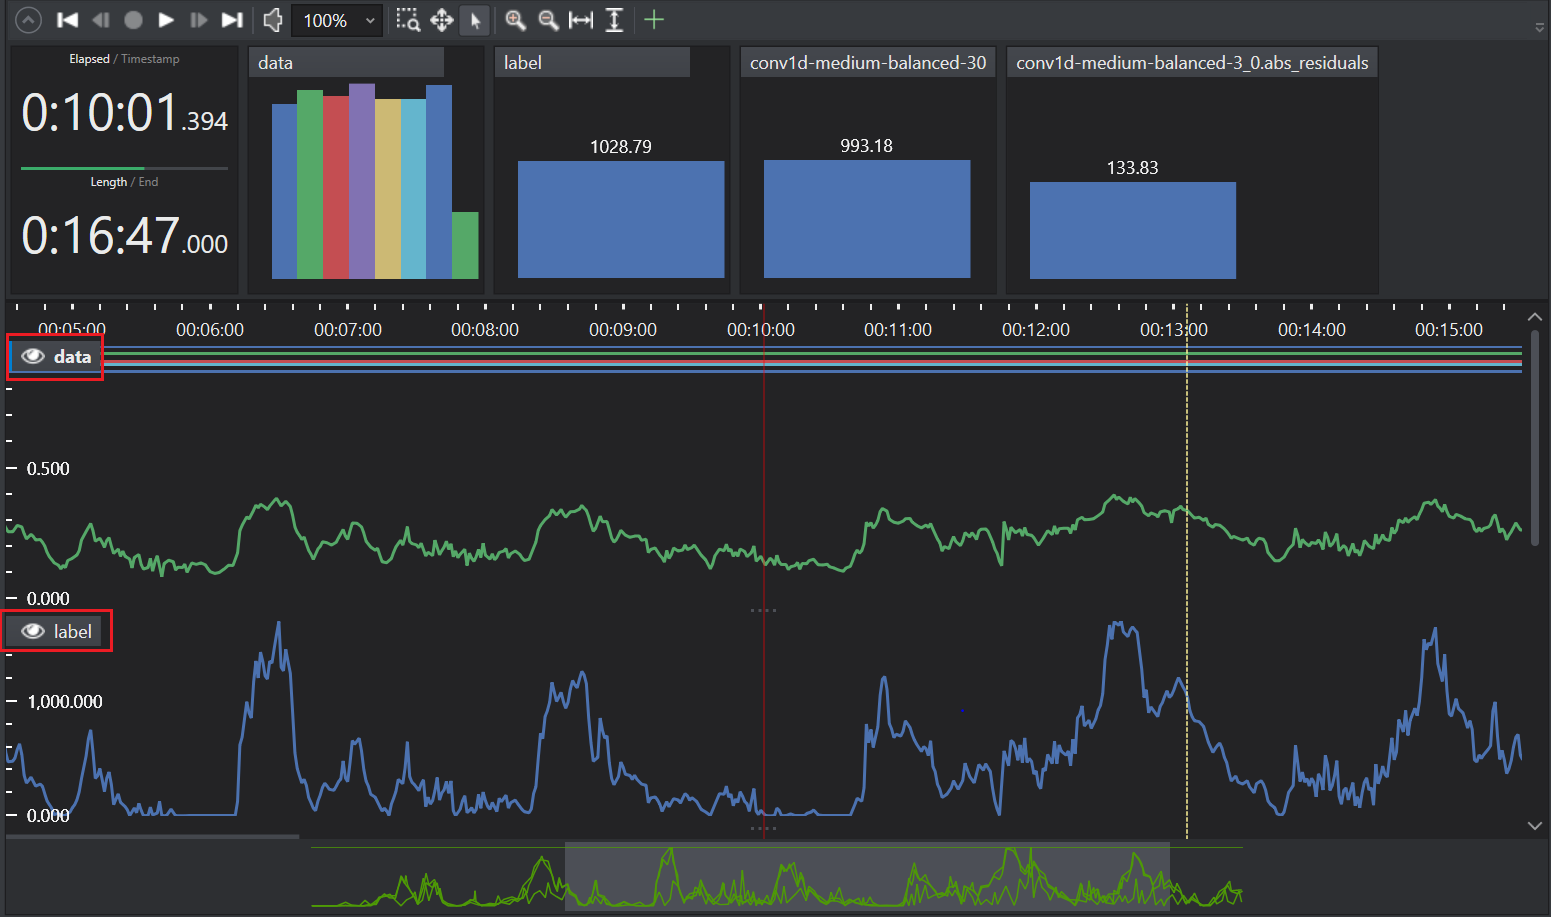
We have organized the data into weekly blocks, with each block containing data for one week. The data.data file includes various parameters such as Bearing Shaft Temperature, Gearbox Bearing Temperature, Gearbox Oil Temperature, Generator RPM, Generator Winding1 Temperature, Generator Winding2 Temperature, Rotor RPM, and Wind Speed. Based on these independent parameters, the active power is recorded in the label.data file. Essentially, for a given set of input variables, we have a corresponding output value that will be used to train the model. This dataset spans a total of 92 weeks.
Sample data file:
Sample data file that will be used as a label:
If you want to add more data to the project, follow the steps below to import data into the project.
Importing data into the project
-
Open the project file present in the project folder.
-
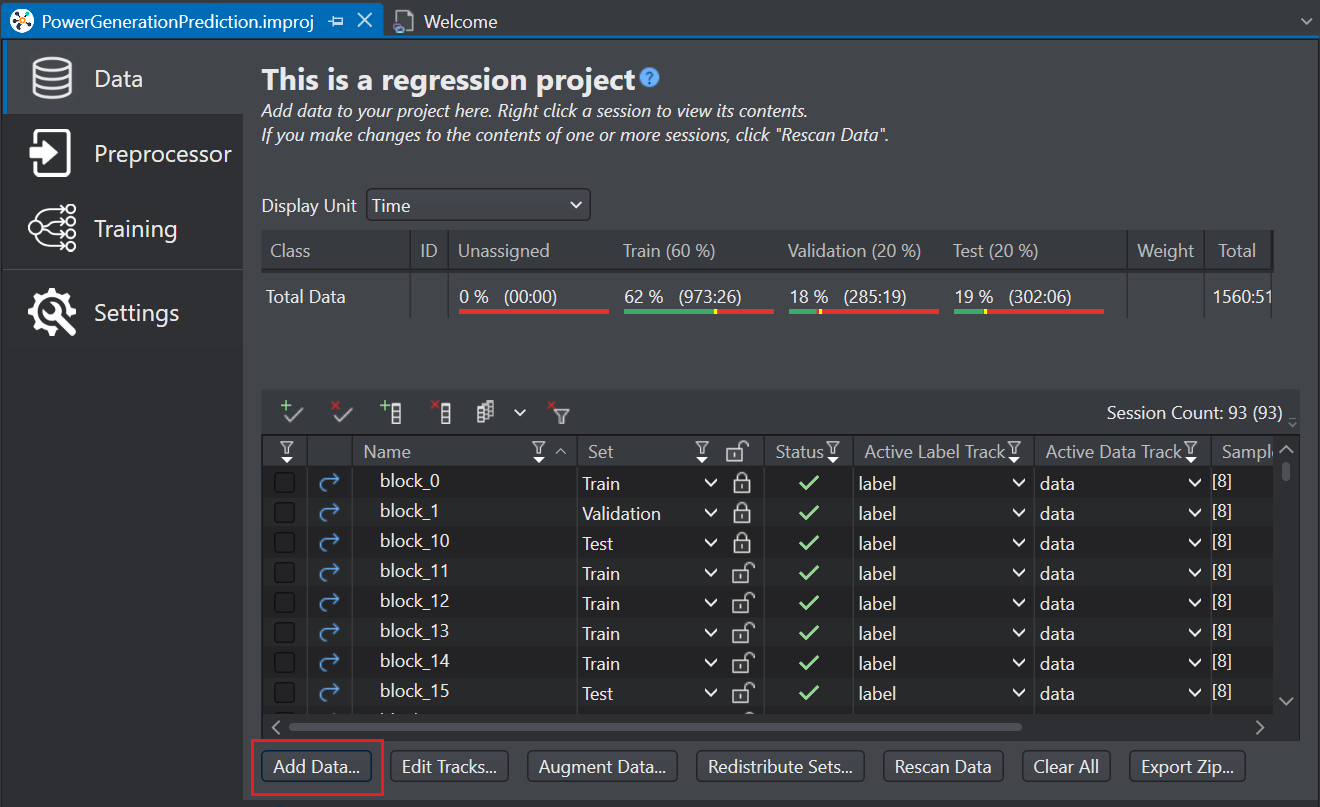
In the Data tab, click the Add Data button at the bottom of the project file. The Add Data window appears.
-
In Source Directory, click the three dot and browse to the folder from you downloaded earlier and click Select Folder. Based on the data type, the files are automatically sorted into the appropriate boxes.
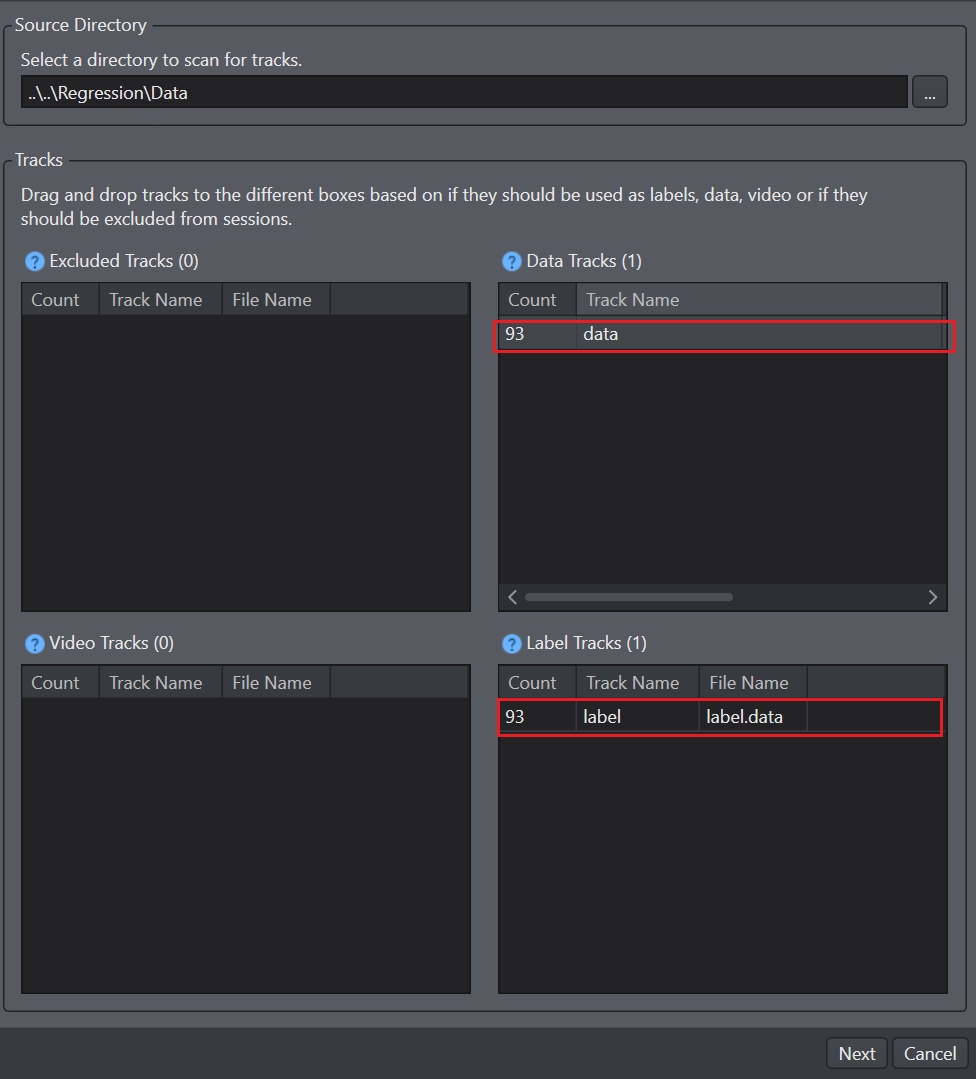
-
Drag and drop the label.data files into the label tracks box so as to use them as label files and click Next. The summary window displays the details related to the new or existing and total sessions that will be generated after the import.
-
Click Ok to import the data into the project.
After you have imported the data into the Studio, you should distribute the data into different datasets. To know how to distribute the data, refer to Data Distribution
Preprocessing
The second main step in building a machine learning model is defining the preprocessor. The collected data needs to be processed before the data is used to train a model. This gives the model better accuracy without changing the architecture of the model.
For one-dimensional data, the minimum preprocessing required is applying a sliding window. However, for data with more than one dimension, a sliding window is not necessary for preprocessing.
To create a pre-processing pipeline:
-
Click Preprocessor tab on the left pane.
-
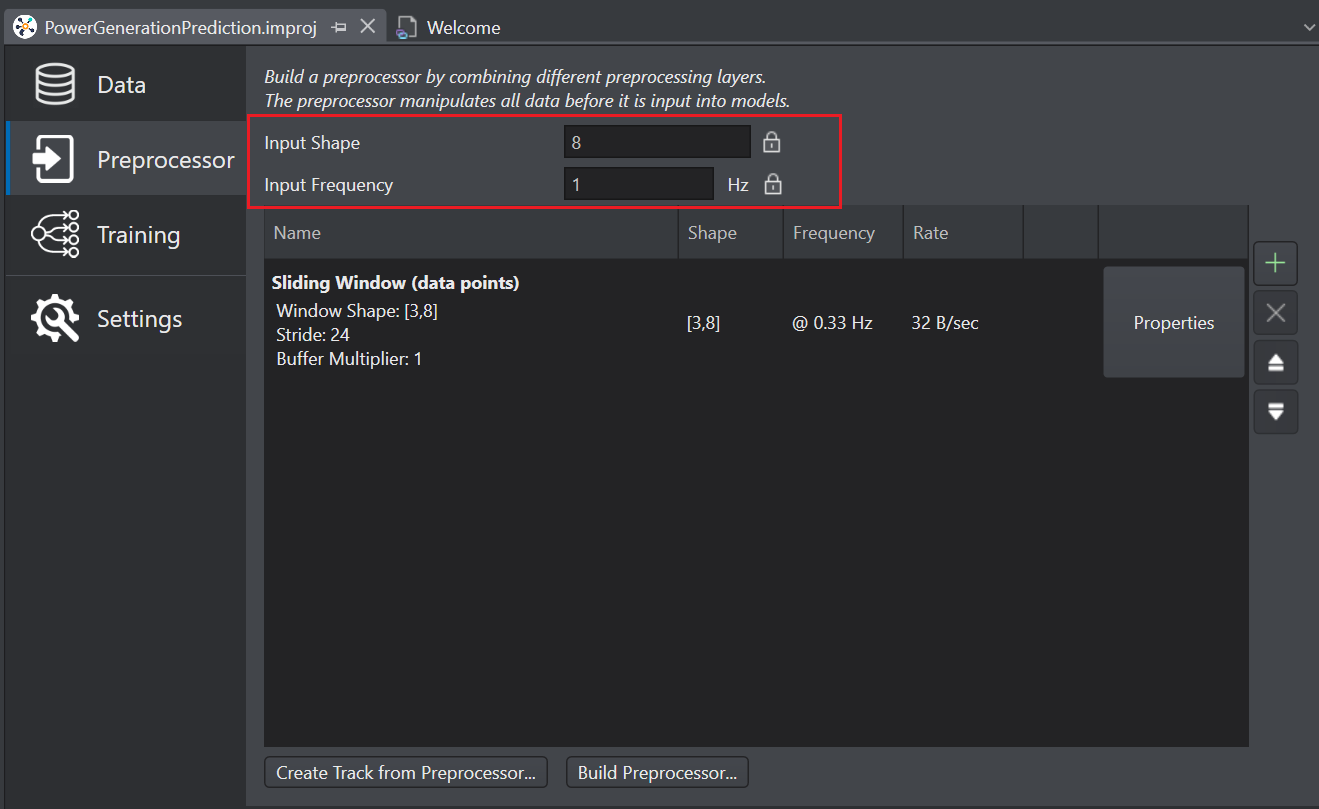
The Input Shape indicates the number of features or dimensions of the input data. In this case, since the data contains 8 different features, the input shape is 8.
- Dimension (feature) 1: Bearing Shaft Temperature
- Dimension (feature) 2: Gearbox Bearing Temperature
- Dimension (feature) 3: Gearbox Oil Temperature
- Dimension (feature) 4: Generator RPM
- Dimension (feature) 5: Generator Winding1 Temperature
- Dimension (feature) 6: Generator Winding2 Temperature
- Dimension (feature) 7: RotorRPM
- Dimension (feature) 8: WindSpeed
- Dimension (feature) 1: Bearing Shaft Temperature
-
The Input frequency indicates the frequency of the input data that is provided to the model. In this case, the input frequency is 1.
Input Shape and Input frequency are computed automatically by Studio.
-
Click the Add icon to add Queues > Sliding Window as the preprocessing layer.
- In stride, select the stride value as 24.
- In Window shape, select the shape as (3,8).
-
Click Ok to add the preprocesing layer.
After you have defined the preprocessor, you can generate and import the new preprocessing tracks into the project. This will be useful in evaluating the new preprocessor with the original preprocessor. Refer Generating the preprocessing tracks and Importing the preprocessing tracks to know the detailed steps.
Training
After you imported the data and design the preprocessor, the data is passed to the model for training. Before the model can be trained, you need to generate the model and define the layers of the model. Studio allows generation of multiple different models to be trained and compared to find the best fitting model.
Generating the model
You can generate multiple model architecture using the Model Wizard. The Auto ML tab in wizard can be configured for different model families, classifiers, sizes, and learning rate. The wizard generates models based on the configuration, speeding up the model development phase by prioritizing the main features of a model. The generated models have different layers and layer configurations and produce slightly different results. The models generated by the Auto ML wizard can be changed layer by layer, allowing the more advanced users to fine tune the models.
To generate model using the Model wizard:
-
Navigate to the Training tab in the project file.
-
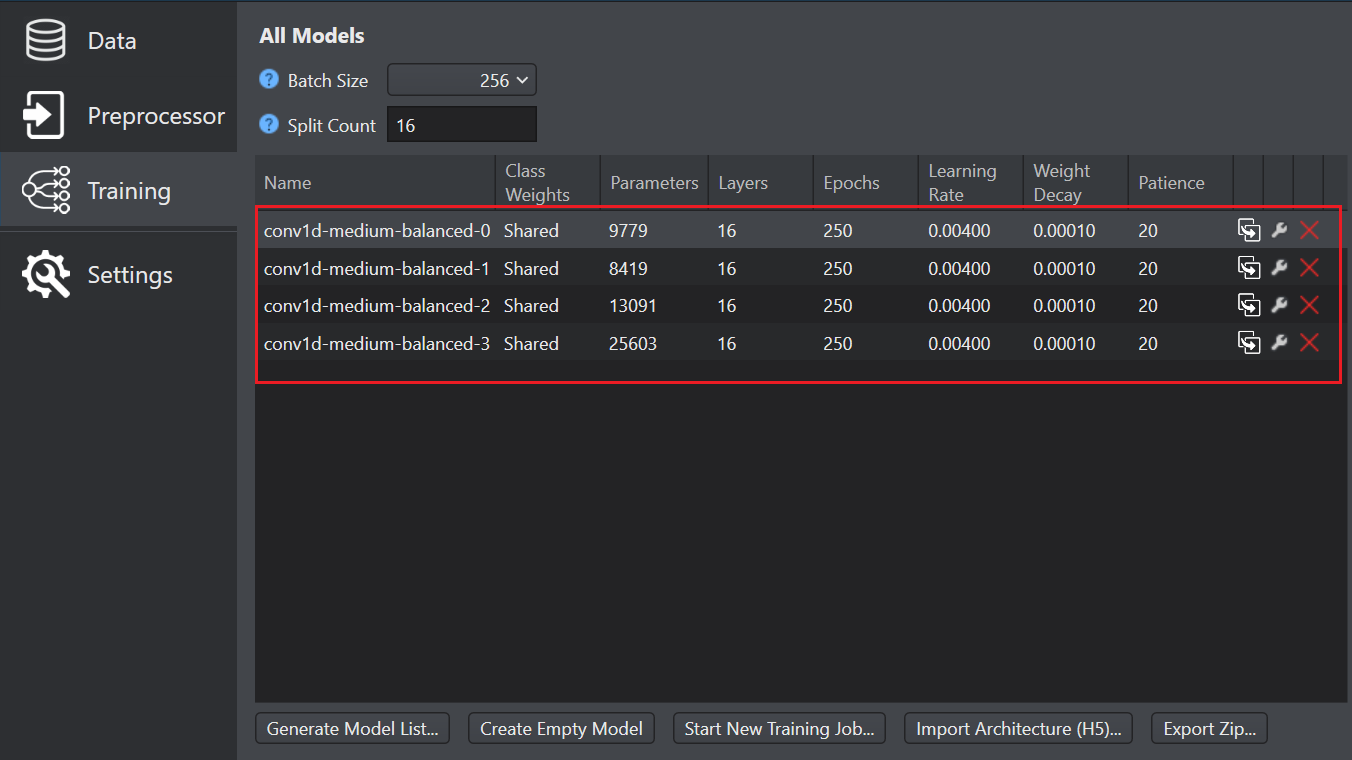
Click Generate Model List button to open the Model wizard. The Auto-ML tab appears with the pre-configured parameters. Keeping most of the parameters as it is, we will change the following parameters to generate different set of models.
-
Click the Training tab, set the following parameters as:
- Batch sizes: 64
- Loss function: Mean Squared Error You can also set Mean Absolute Error, Root Mean Square Error as the loss function.
-
Click Ok to generate the models. The new set of models appear in the list.
Training and Evaluating the model
After you have a list of models, you can train and evaluate the models to see which one produces the best results. Studio offers many different statistics and metrics to analyze the strengths and weakness of a model. The statistics include accuracy of validation and test data as well as confusion matrix to see which model performed well.
Refer to Starting Model Training and Tracking the training job to see the detailed instructions on how to start and track the training job respectively.
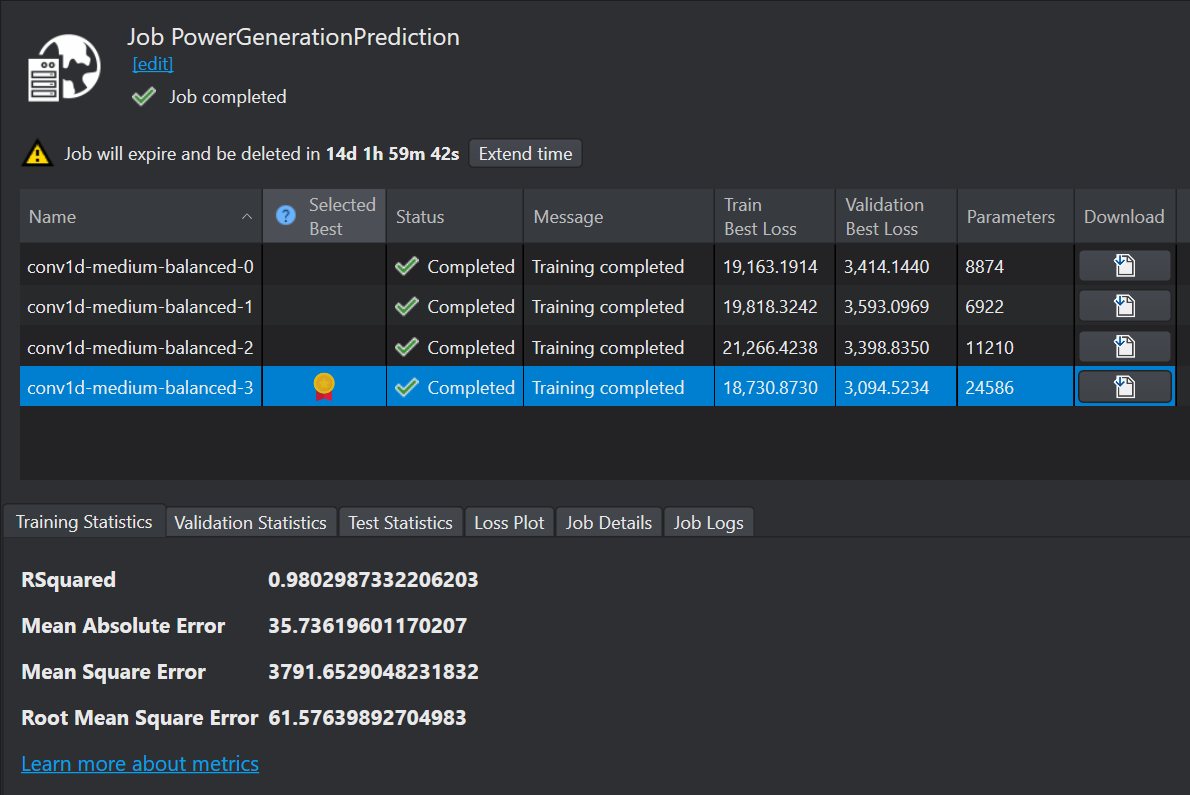
After the model is trained in Imagimob Cloud, the detailed performance data of each the model is available. To view the performace summary, log into the cloud services by clicking Imagimob Cloud> Browse Cloud Jobs in the Studio Menu bar. You can analyze performance factors such as Mean Absolute Error (MAE), Mean Square Error (MSE), and Root Mean Square Error (RMSE) for different models. The R² value typically ranges from 0 to 1, with 1 indicating that predictions perfectly match the observed values. It is not possible for R² to exceed 1.
You can download the model with best results. Refer to download the model files for detailed steps. After downloading the model files, open the model file to evaluate the model. The *.h5 model file contains the following tabs:
• Preprocessor: This tab contains the preprocessor information defined for the project.
• Network: This tab provides details about the layers of the model, activations and parameters.
• Evaluation: This tab contains the performance data with additional filtering and visualization capabilities.
• Code Gen: This tab allows you to generate the code for the selected model.
To know how to evaluate the regression model using Studio, refer to Evaluating Regression Models for details steps.
After completing this tutorial, you will understand how to build a regression model using Studio. Similarly, you can tackle a problem using the regression algorithm by creating an empty regression project within the Studio.