Real-Time Data Collection from Sensors using old streaming firmware/protocol
-
This topic is relevant only if you are using the Infineon PSOC™ 6 development kit with old firmware or sensor whose firmware is implemented using Protocol Version 1 .
-
Protocol version 1 is deprecated and we recommend using Tensor Streaming Protocol version 2 for improved performance and easy implementation. However, we continue to support the backward compatibility. This means that if your firmware is currently implemented using Streaming Protocol version 1, you will still be able to stream data into Studio without any issues. To know more, refer to Tensor Streaming Protocol for Real-Time Data Collection.
Graph UX provides the flexibility to capture the real-time using a built-in PC microphone, camera, sensor or any development board. You can add additional data to your existing projects or build your own dataset from scratch. You can collect labeled as well as unlabeled data as per your project requirement.
If you are using the Infineon PSOC™ 6 development kit to collect data, ensure that you flash your board with the Streaming Firmware. Refer to Streaming Firmware for PSOC™ 62S2 Wi-Fi BT Pioneer Kit section for detailed flashing instructions.
If you are collecting data using a board flashed with old streaming firmware/ Protocol version 1, make sure you select Serial Capture Nodes with Protocol Version 1 option in Tools> Options> General, before collecting data.
How to collect real-time data?
Collecting real-time data using Graph UX is straightforward:
- Create a Graph UX Project
- Create the Data Collection Graph
- Collect real-time data
Creating Graph UX Project
You can create an Empty Graph UX project or Live Data Collection Starter Graph UX project containing an example graph. Refer to How to get started with Graph UX? for instructions on creating the Graph UX project.
If you select Live Data Collection Starter Graph UX project to collect data, set up the input node and start collecting data but if you select Empty Graph UX project to collect data, you need to create the data collection graph. Follow the steps below to create the data collection graph.
Creating Data Collection Graph
To create the data collection graph, follow the steps:
Step 1: Select the Input node to stream data
Input nodes are designed to collect data from various sources, such as local microphone, local camera, sensors, or development boards and pass on the data to other nodes in the graph. The Input nodes are placed at beginning of the graph. You can collect data using multiple input nodes at a time.
- Local Microphone - for streaming audio data using the built-in PC microphone
- Local Camera - for streaming video data using the using built-in PC camera
- Serial Capture - for streaming data from PSOC™6 Pioneer Kit with IoT sense expansion kit or any sensor/ development board
Step 2: Set-up the Visualization tracks
The Visualization Nodes help in visualizing the data collected from the Input nodes as tracks in session file.
- Data Track - for visualizing the sensor data collected from Local Microphone, Serial Capture.
- Video Track - for visualizing the video data collected from Local Camera node.
- Label Track - for visualizing and labeling the collected data.
Depending on the type of data you want to collect and how you plan to collect it, you can create different data collection graphs.
-
To collect audio data using the built-in PC microphone, connect the Local Microphone node to the data track. For collecting data using local microphone, refer to Setting up Local Microphone.
-
To collect data from PSOC™6 Pioneer Kit or any sensor/ development board, connect the Serial Capture to the data track. For collecting data using the Serial Capture, refer to Setting up Serial Capture.
However, if you want to collect video data along with audio or sensor data, connect the Local Camera to the video track to the existing graph. For collecting data using the Local Camera, refer to Setting up Local Camera.
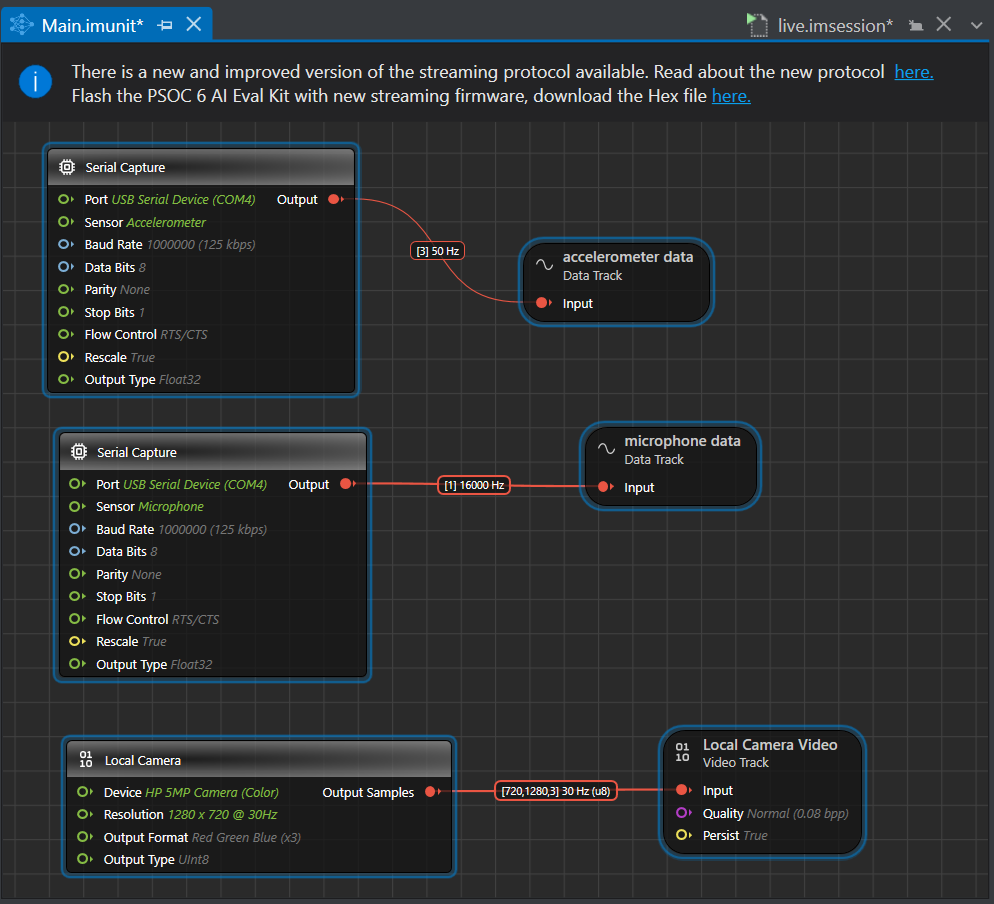
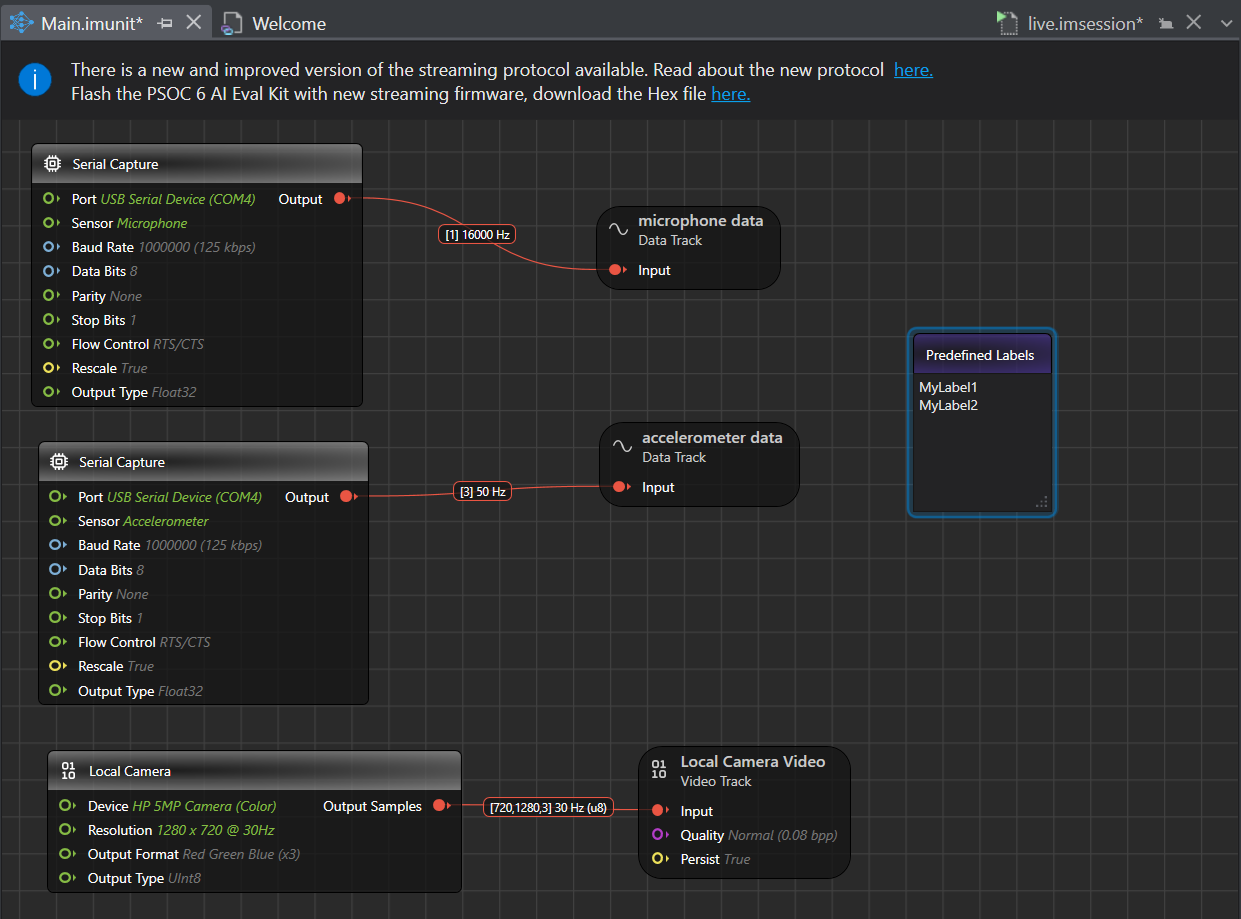
For instance, the graph illustrating the process of collecting accelerometer data, microphone data and video data at a time using the PSOC™6 Pioneer Kit can be represented as follows:
Setting up Local Microphone
To set up the Local Microphone, follow the steps:
-
Connect the microphone or use the speaker of the laptop or PC.
-
Double-click the Main.imunit file to open the canvas.
-
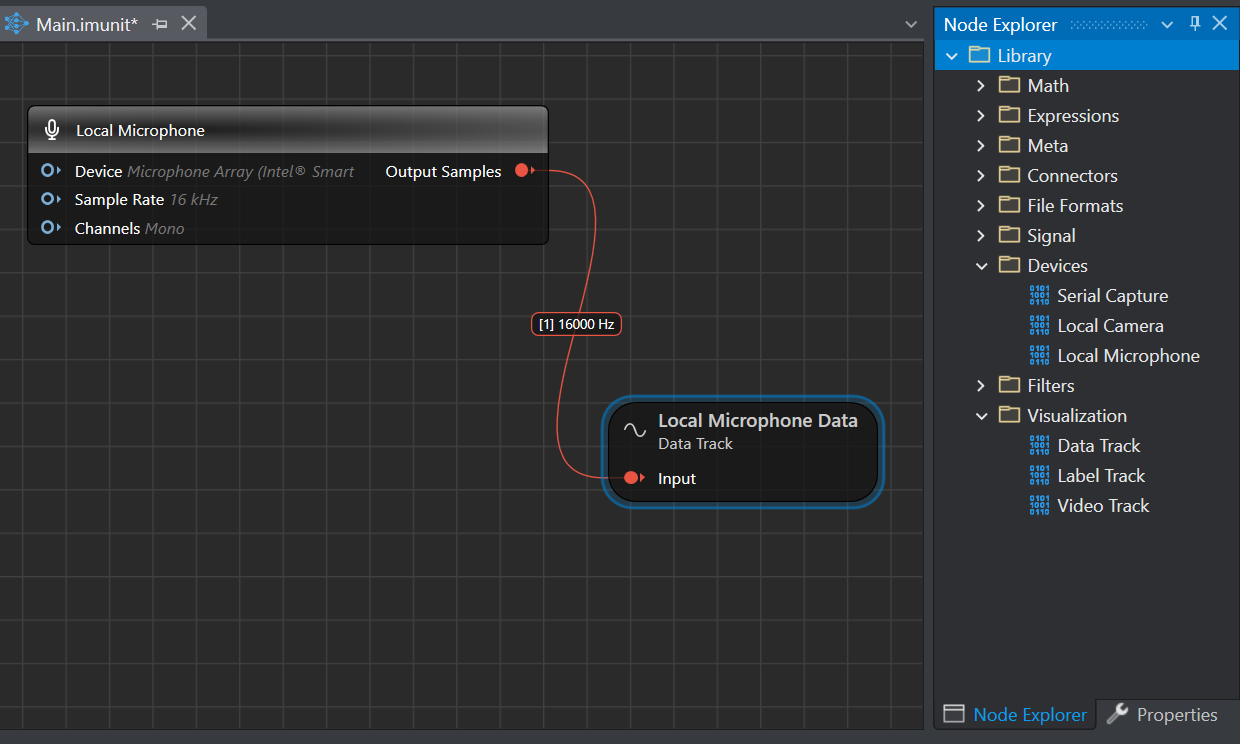
Navigate to the Node Explorer window and expand Library> Capture Devices and drag and drop the Local Microphone unit onto the canvas.
The tabs represents the default properties of the local microphone:
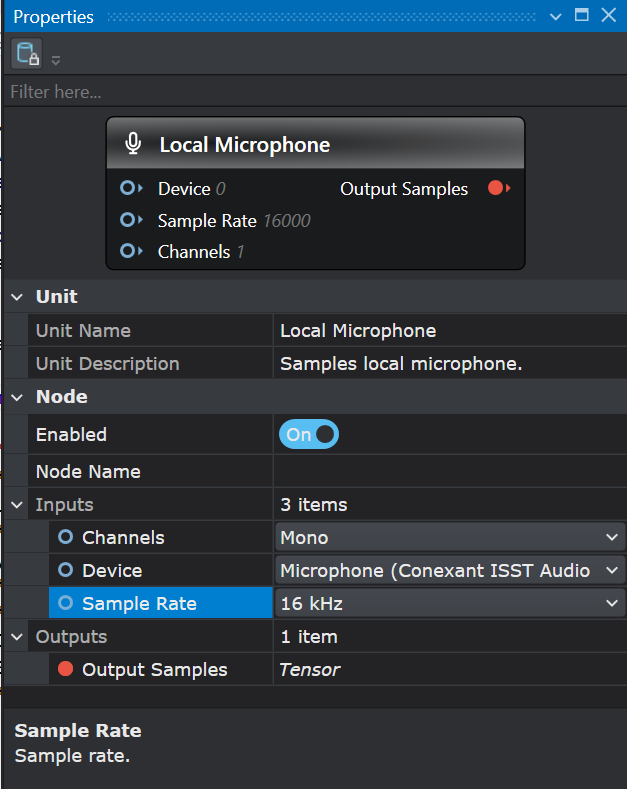
Unit
Unit Name : Displays the name of the unit
Unit Description : Displays the description of the unit -
Navigate to the Node Explorer window, expand Library> Tracks and drag and drop the Data Track onto the canvas.
-
Connect the Output of the Local Microphone Node to the Input of the Data Track by clicking on the red icon in the Local Microphone node and dragging over to the red icon in the Data Track node. This creates a connection between the two nodes.
Setting up Serial Capture
If you want to stream data from PSOC™6 Pioneer Kit with IoT sense expansion kit or any sensor/ development board, set up the Serial Capture following the steps below:
-
Connect the PSOC™6 Pioneer Kit with IoT sense expansion kit to laptop or PC using the serial port.
-
Double-click the Main.imunit to open the canvas.
-
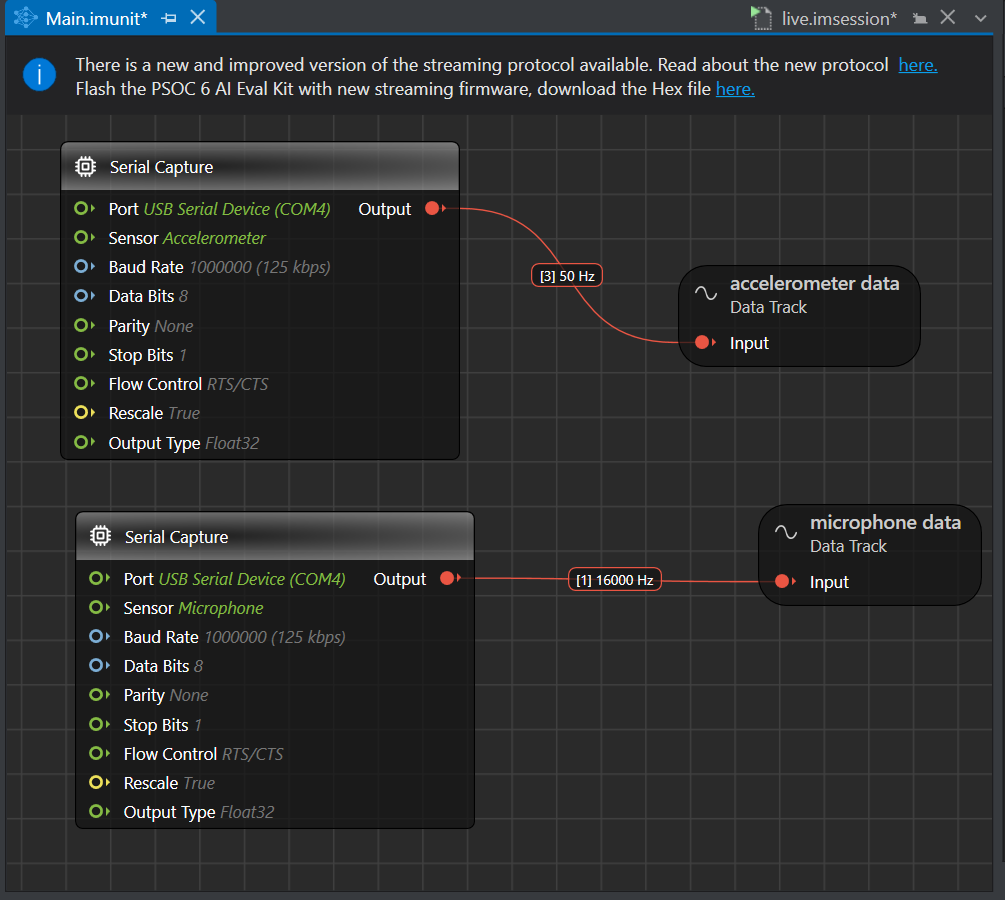
Navigate to the Node Explorer window and expand Library> Capture Devices and drag and drop the two Serial Capture unit onto the canvas, as we want to collect accelerometer and microphone data simultaneously. If you want to collect accelerometer or microphone data use only one serial capture node. Set one serial capture node to collect microphone data and other serial capture node to collect microphone data.
The tabs represents the default properties of the Serial Capture :
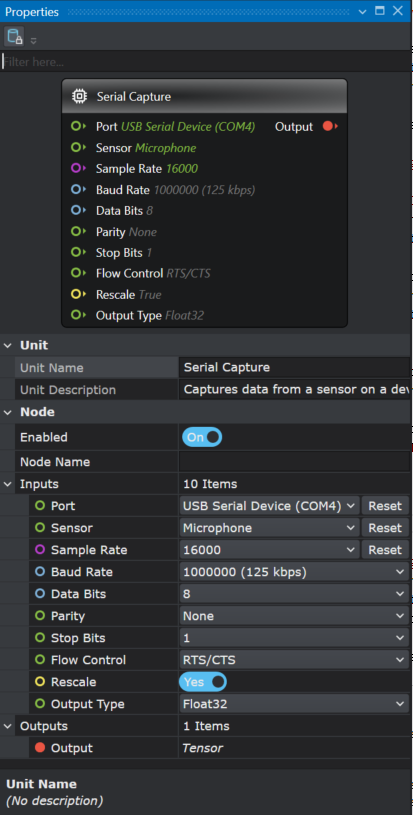
Unit
Unit Name : Displays the name of the unit
Unit Description : Displays the description of the unit
Similarly, you can collect data from any sensor or development kit by using the Serial Capture Node and setting the properties.
-
Navigate to the Node Explorer window, expand Library> Tracks and drag and drop two Data Tracks onto the canvas to collect data from both Microphone and Accelerometer simultaneously. However, if you only want to collect data from either Microphone or Accelerometer, then drag and drop one Data Track onto the canvas.
-
Connect the output of the Serial Capture (accelerometer) to the Input of a Data Track by clicking on the red icon in the Accelerometer and dragging over to the red icon in the Data Track. Similarly, connect the output of the Serial Capture (microphone) to the Input of another Data Track. This creates a connection between the nodes.
Setting up Local Camera
To set up the Local Camera, follow the steps:
-
Connect a camera or use the built-in camera of the laptop or PC.
-
Double-click the Main.imunit file to open the canvas.
-
Navigate to the Node Explorer window and expand Library> Capture Devices and drag and drop the Local Camera unit onto the canvas.
The tabs represents the default properties of the local camera:
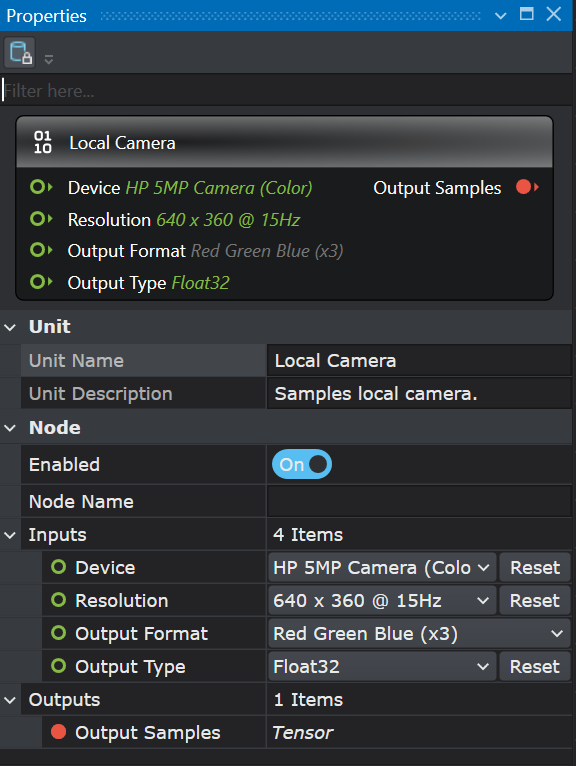
Unit
Unit Name : Displays the name of the unit
Unit Description : Displays the description of the unit -
Navigate to the Node Explorer window, expand Library> Tracks and drag and drop the Video Track unit onto the canvas.
The tabs represents the default properties of the video track:
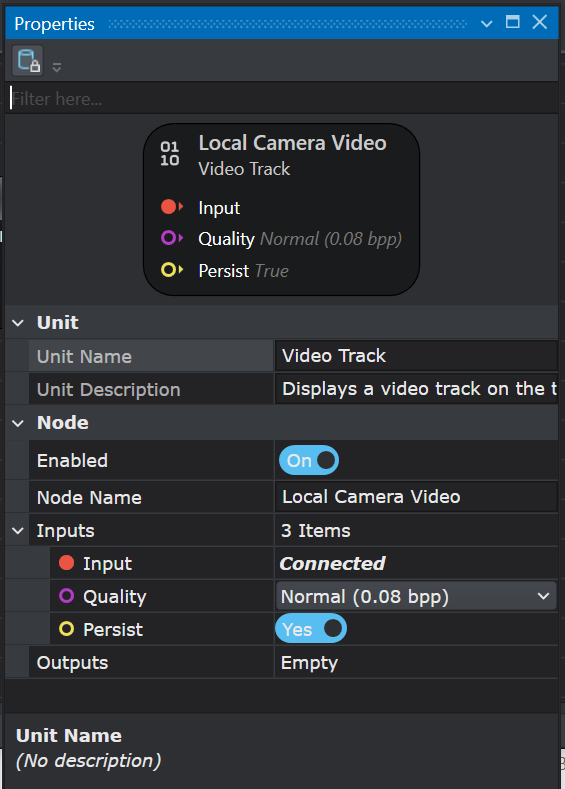
Unit
Unit Name : Displays the name of the unit
Unit Description : Displays the description of the unit
Disabling the Persist option enables real-time video streaming without saving the footage. As a result, replaying or rewinding the video will not be possible. This configuration is optimal for real-time model evaluation when video storage is not required.
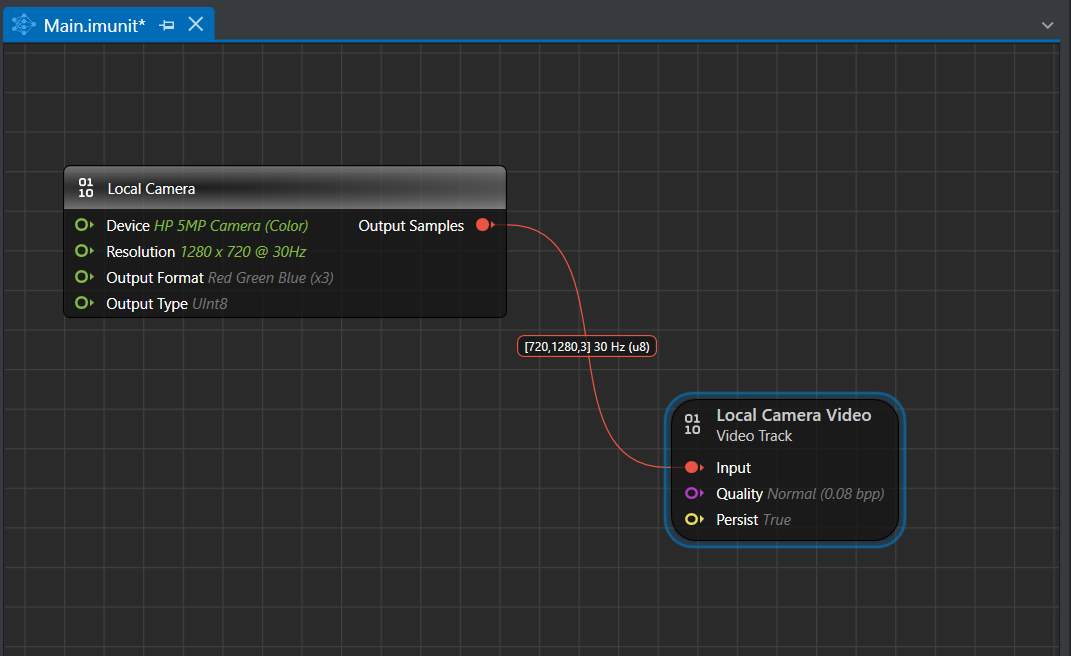
- Connect the Output of the Local Camera Node to the Input of the Video Track by clicking on the red icon in the Local Camera node and dragging over to the red icon in the Video Track. This creates a connection between the two nodes.
Real-time data collection
After illustrating the graph for collecting data accordingly, follow the steps to capture the real-time data:
-
Navigate to the toolbar and click the Start button to open the live.imsession file. An empty session file opens.
-
Click the Record button to start the recording.
-
Capture the real-time data for few seconds.
-
Click the Record button to stop the recording.
-
Select File>Save Main.session As, if you only want to the save the session file. However, select File>Save to save the session file as well the data track. The Save New Session window appears.
-
In Location, click the three dot and select the desired location to save the file.
-
In Session Name, enter the name of the session file.
-
Under Track Options, you can set the followings:
• In Wave Format Encoding, select the encoding format for the audio tracks.
• In Track Name, double-click the column to edit the track name, if required.
• In File Name, double-click the columns to edit the track name, if required. -
Select the save checkbox corresponding to the tracks you want to save.
-
Click OK to save the files.
-
Repeat the instructions from step 2 to collect and save data in multiple session files.
Similarly, you can collect data using the other data collection Input nodes, described above.
Collect labeled data using Graph UX
After you created a data collection graph to collect the data, you can utilize the same graph to label the real-time data, by adding a Pre-defined Labels node onto the canvas. Define the classes in the Predefined Labels node for one time and utilize the defined classes to label the data on a click of button.
Defining classes in the Predefined Labels node
To define classes in the Predefined Labels node, follow the steps:
- Double-click the Main.imunit where you created the graph for collecting data.
- Navigate to the Node Explorer window and expand Annotation and drag and drop the Predefined Labels unit onto the canvas. The Predefined Labels node displays the default classes.
- Define the classes in Predefined Labels node by entering every class in a new line.
- Navigate to the toolbar and click the Start button to open the session file (.imsession). An empty session file opens displaying the pre-defined classes in the Labels bar.
How to collect labeled data using Graph UX?
To label the real-time data using the Graph UX, follow the steps:
-
Navigate to the toolbar and click the Start button to open the main.imsession file. An empty session file opens displaying the predefined classes in the Labels bar.
-
Click the Record button to start capturing the real-time data for few seconds.
-
In the Labels bar, select the class to start adding labels to the streaming data. As you select the class, the label with that class is added to the real-time data.
-
Deselect the class to stop adding the labels to the streaming data.
• You can also enable or disable the class using the keyboard shortcuts displayed when hovering over the classes in the Labels bar.
• After collecting the data, you can fine-tune the labels accordingly.
-
Click the Record button to stop the recording after you have labeled the data.
-
Select File>Save Main.session As, if you only want to the save the session file. However, select File>Save to save the session file as well the data and the label track. The Save New Session window appears.
-
In location, click the three dot and select the desired location to save the file.
-
In Session Name, enter the name of the session file.
-
Under Track Options, you can set the followings:
• In Wave Format Encoding, select the encoding format for the audio tracks.
• In Track Name, double-click the column to edit the track name, if required.
• In File Name, double-click the columns to edit the track name, if required. -
Select the save checkbox corresponding to the tracks you want to save.
-
Click OK to save the files.
-
Repeat the instructions from step 2 to create multiple session files.