Evaluating Object Detection model
Model evaluation is an essential step in the development of a machine learning model. It helps us understand the strengths and weaknesses of the model, ensuring it performs effectively on new, unseen data. By thoroughly assessing various performance metrics, we can make informed decisions to enhance the model’s accuracy and reliability.
Performing Model Evaluation
DEEPCRAFT™ Studio provides the following ways to evaluate the Object Detection model:
- Evaluating the model using statistics and metrics
- Evaluating the model Predictions with Original Data
- Evaluating the model using Graph UX
Evaluating the model using statistics and metrics
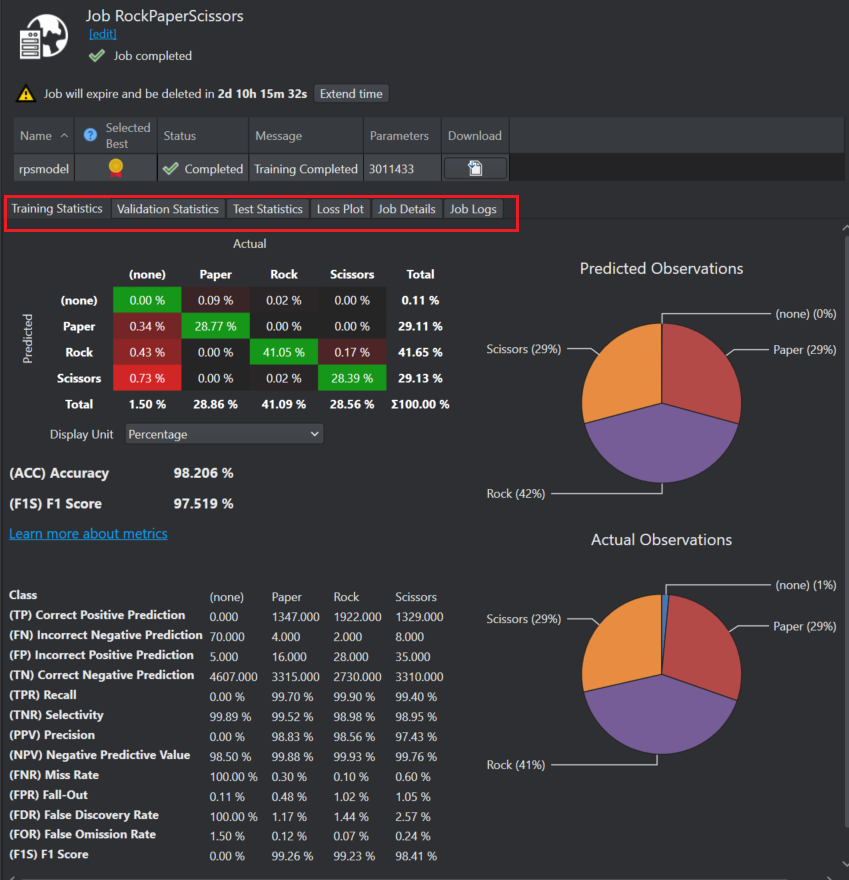
After the model is trained in Imagimob Cloud, the detailed performance data of the model is available for the model. To view the performance summary, log into the cloud services by clicking Imagimob Cloud> Browse Cloud Jobs in the Studio top bar and open your training job.
Studio provides various evaluation performance metrics such as accuracy and F1 score across different phases (Train, Validate, Test). You can also view the detailed information about the model’s parameters and complexity. You can examine tables and charts that illustrate the model’s ability to distinguish between data points, its performance against test data, the features utilized, and the layers used.
Evaluating the model Predictions with Original Data
Compare the model predictions to the original data. Along with the model, a set of predictions is downloaded and placed in the Model> Sessions directory. These predictions can be used to evaluate the trained model by comparing the bounding boxes generated by the model with the original bounding boxes in the datasets. DEEPCRAFT™ Studio provides a detailed view of the model’s performance by merging the model predictions with the sessions containing the original data.
Importing predictions into your project
To import predictions, follow the steps:
-
After you have downloaded the model, navigate to the project directory and open the project (.improj) file.
-
In the Data tab, click Merge button and browse to select the Predictions folder. By default, the predictions are saved in Models> Model> Sessions.
-
Select the Nested structure or Flat structure radio button and click Next. Predictions from the selected folder will be merged as label_Predictions into the corresponding local sessions.
-
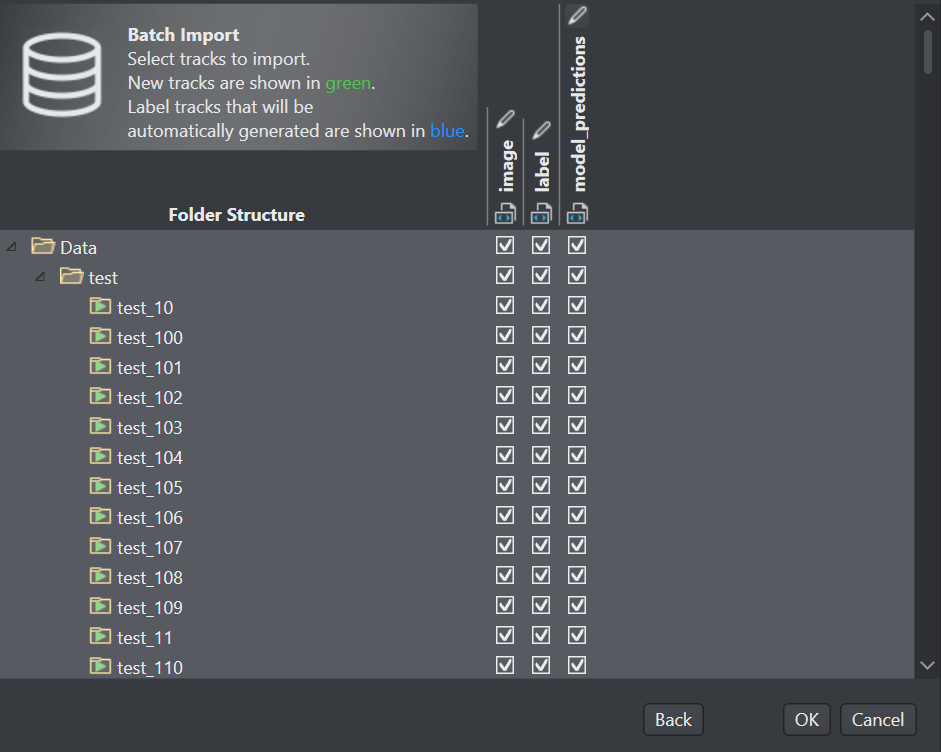
Select or deselect what you want to import and click OK to complete the merge. If needed, you can change the name of the tracks by clicking the pencil icon placed at the top of the window.
Now you can evaluate how the imported model predictions compare to the labels from the training data.
-
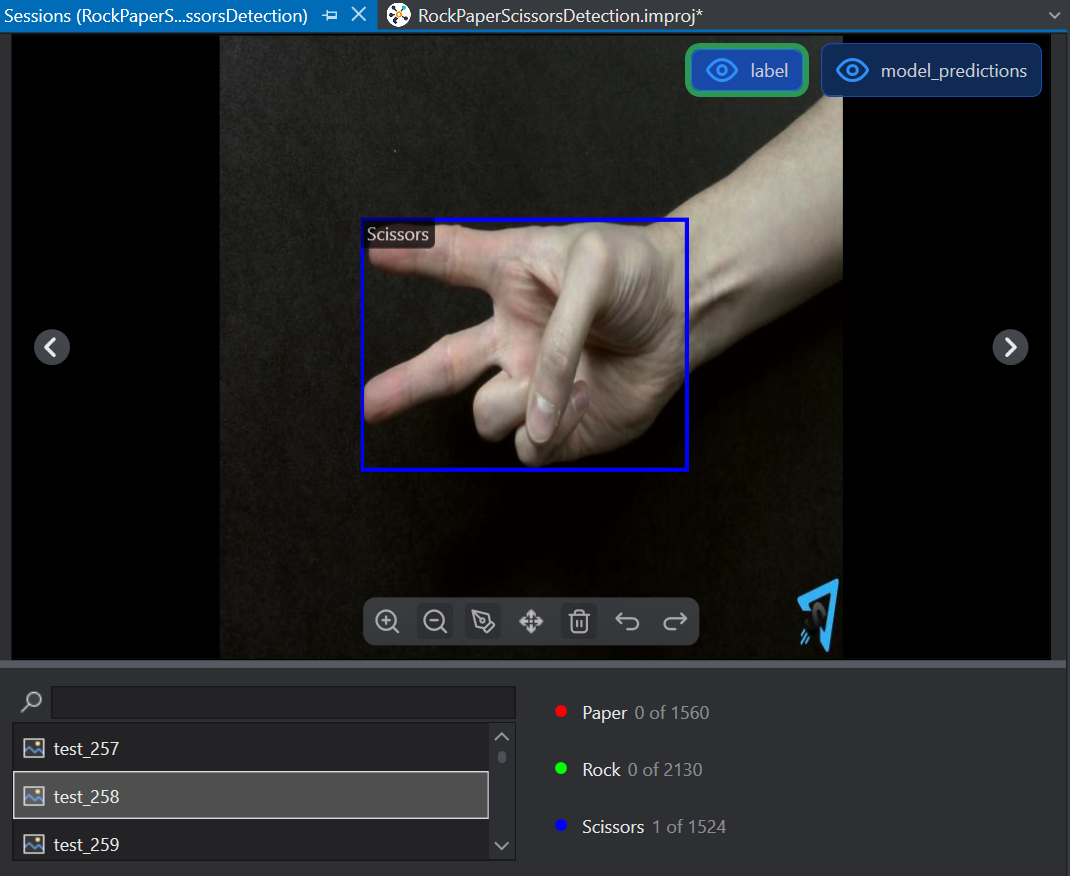
Double-click a session in the table of the Data tab of your project to open. The Session opens in a new tab showing the combined bounding boxes from the predictions and original data.
-
The bounding box in the original data and in the predictions are of the same color of the class predicted. Click the Eye icon in the label or model-predictions buttons to hide either the original or the predicted label to evaluate properly. This allows for easy comparison to determine if there are any discrepancies between the label and predictions. If so, the data can be looked at to see if there are anomalies or if the label is possibly incorrect.
-
Click the Next and Previous arrows in the Evaluation window to evaluate the other session file in the similar way explained above.
Evaluating Object Detection model using Graph UX
Graph UX supports real-time model evaluation functionality which helps in analyzing and monitoring the model predictions before deploying a model to production. It also ensures that the model generates accurate predictions on real-time data.
Understanding the Graph Flow
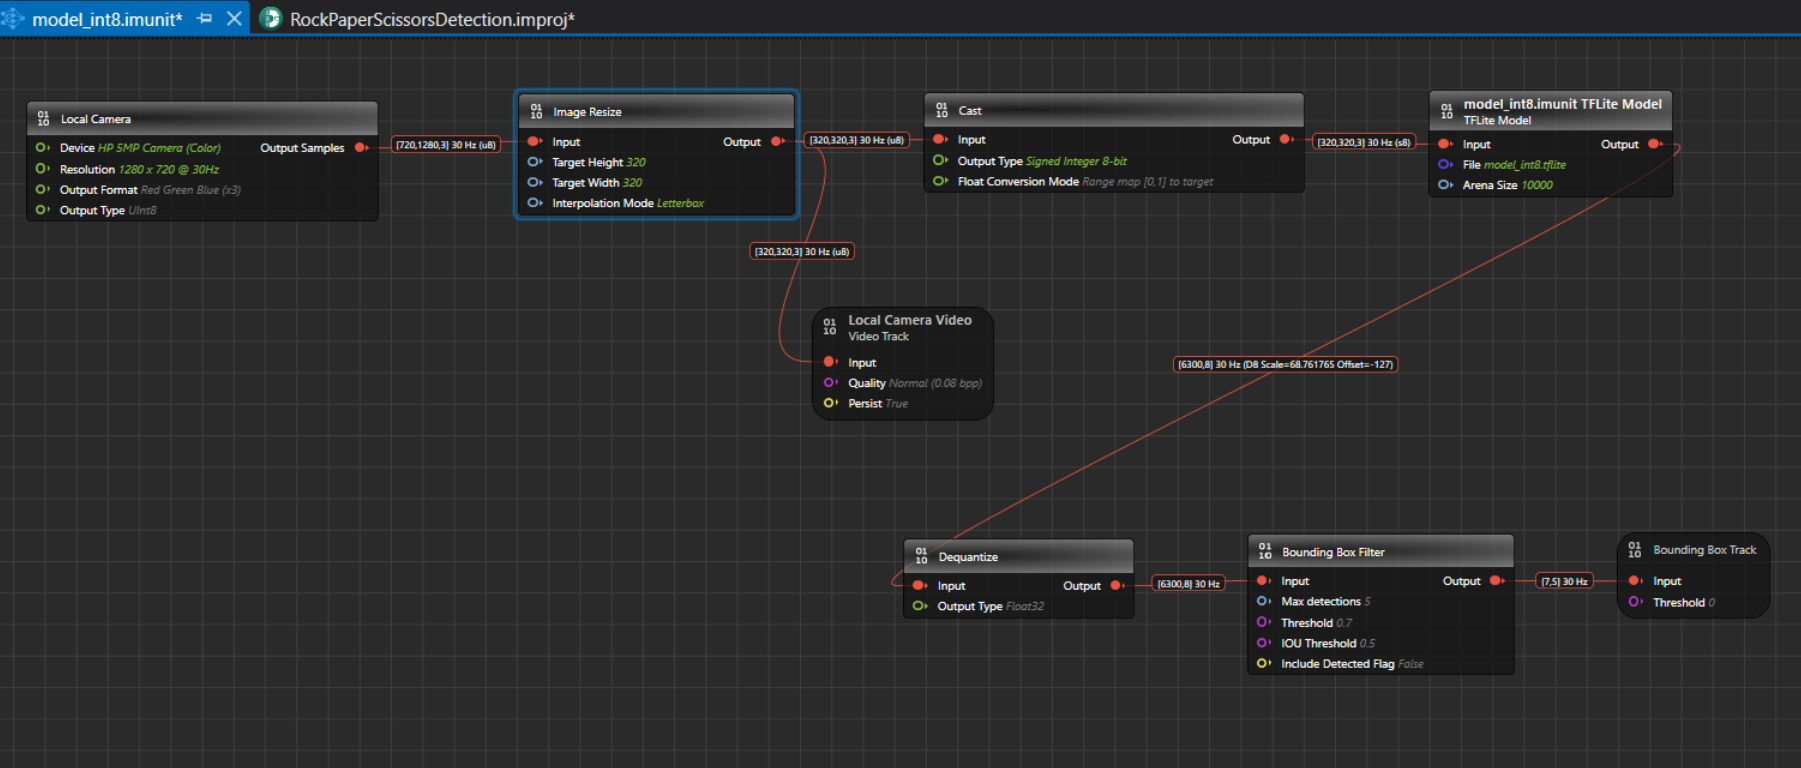
The Model Evaluation Object Detection Graph begins with the Local Camera Node, which streams live video data at the resolution, channel settings and output type specified in the node. For instance, the output shape from the Local Camera Node is [720,1280,3]30 Hz (u8), where 720x1280 represents the video frame dimensions, 3 indicates the RGB color channels, 15 is the frame rate and u8 is the output type in unsigned Integer-8 format. The output from the local camera is input to Local camera video track node and Image Resize node. The local camera video track node helps to visualize video data collected from the Local Camera node.
The streaming video frames from the local camera node are then passed to the Image Resize Node. The Image Resize node preserves the aspect ratio by scaling the image to fit within the target size and padding the remaining space with a constant color. This approach avoids cropping, stretching, and blurring, which helps the model predict more accurately and consistently. By default, the Image Resize node applies letterbox padding to reach the target input size expected by the model. You can configure the interpolation mode to bilinear or nearest‑neighbor, depending on your performance and quality requirements. For YOLO models, use letterbox because it mirrors the preprocessing typically used during training and aligns with the vision code example, thereby improving inference reliability.
Correct resizing is critical for optimal performance; improper resizing can degrade accuracy, stability, and overall model reliability. In this example graph, the model was trained on images of size 320x320, so the Image Resize Node is set to resize frames to 320x320 automatically. If you are unsure of the expected image size, you can check it on Netron . By default, the settings for the Image pad node is defined. Click the node, if you want to view or edit the settings in the Properties window accordingly. The local camera video track node helps to visualize video data collected from the Image resize node. By default, the settings for the local camera node is defined. Click the node, if you want to view or edit the settings in the Properties window accordingly.
Once resized, the image frames with an input shape of [320,320,3]@15 (u8) are fed to the Cast Node, which convert tensor elements from one type to another. The camera provides unsigned 8-bit values in the range 0–255, while the model in the graph expects signed 8-bit values in the range −128 to 127. To preserve the full dynamic range during integer-to-integer conversion, we apply full-range linear mapping so that 0 maps to −128 and 255 maps to 127. This approach avoids clipping or saturation, maintains the original contrast and detail, and ensures the model receives data in the format it was trained to consume. This conversion stage standardizes the input values to the model’s expected signed domain, improving numerical consistency across inferences. By using full-range mapping, we retain sensitivity to both dark and bright regions, which supports stable predictions.
The output from the cast node is fed into the model, which detects the classes or objects it was trained on. In this case, the model detects hand gestures such as Rock, Paper and Scissors. The output shape of the model is [6300,8] 30 Hz (D8 scale and offset), where 8 represents the sum of 3 classes(Rock, Paper, Scissors), 4 bounding box coordinates, and 1 Detected Flag option, to detect the validity of each prediction ( 1 for a valid detection; 0 for padding) and 6300 represents the prediction results and D8 contains the information about the scale and offset to convert the quantized values to float 32.
The output from the model is fed to the Dequantize node, which convert quantized integers to floating-point values. This conversion provides a more interpretable data type than quantized integers.
This output shape from the Dequantize node becomes the input for the Bounding Box Filter Node. The Bounding Box Filter Node applies Non-Max Suppression (NMS), a post-processing technique used in object detection algorithms. NMS eliminates redundant overlapping bounding boxes by filtering out those with low confidence scores and selecting only the most confident ones. It sorts the remaining bounding boxes by their confidence scores and iteratively suppresses boxes that overlap significantly with the highest-scoring box.
The output from the Bounding Box Filter Node is then fed to the Bounding Box Track Node, which displays the bounding boxes. The input shape for this node should be [Confidence, Detection], where Confidence includes (Center X, Center Y, Width, Height, ClassN…). These bounding boxes are finally displayed on the Video Track Node on the timeline, allowing you to visualize the model in action with live streaming video data and bounding boxes drawn on the detected objects.
How to evaluate the model using Graph UX?
Evaluating the object detection model is straightforward using Graph UX in DEEPCRAFT™ Studio.
Step 1: Connecting your camera
You can use any of the following cameras to evaluate the object detection model in Studio:
- Built-in PC/Laptop camera
- External webcam
Step 2: Creating Model Evaluation Object Detection Graph UX project
To start evaluating the object detection model in studio, you need the Model Evaluation Object Detection project which contains an example evaluation graph, which you can use to evaluate your model. Navigate to your object detection project directory, expand Tools> Model Evaluation Object Detection and open the Main.imunit to get the evaluation graph.
You can also create the Model Evaluation Object Detection from the New Project template. Refer to How to get started with Graph UX? for instructions on how to create the project.
Step 3: Setting the different Nodes in the Graph
-
Click the following Nodes one by one to edit the settings in the Properties window accordingly.
Setting the Properties of Local Camera Node
Local Camera Node Properties Unit Unit Name: Displays the name for the unit. This parameter is not editable.
Unit Description: Displays the description of the unit.Node Enabled: Turn the radio button ON or OFF to enable or disable the node respectively.
Node Name: Enter the name you want to assign to the node.Inputs Device: Select the camera for real-time video streaming.
Resolution: Select the resolution for real-time video streaming from the list.
Output Format: Select the output format from the list.
Output Type: Select the output type from the list - UInt8 or Float32. We recommend selecting UInt8, as Float32 tends to be slower.Outputs Output Type: Displays the output sample. Setting the Properties of Image Resize Node
Image Resize Node Properties Unit Unit Name: Displays the name for the unit. This parameter is not editable.
Unit Description: Displays the description of the unit.Node Enabled: Turn the radio button ON or OFF to enable or disable the node respectively.
Node Name: Enter the name you want to assign to the node.Inputs Input: Displays the connection status of the Image Pad node.
Target Height: Enter the image height in pixels.
Target Width: Enter the image weight in pixels.Interpolation mode Letterbox: Select this mode if you want to preserve the aspect ratio by scaling the image to fit within the target size and padding the remaining space with a constant color.
Nearest-Neighbor: Select this mode if you want to resize by assigning each output pixel the value of the closest input pixel, without any blending. This method is accurate but compute heavy than the bilinear. This method preserves exact pixel values, but it produces blocky, jagged edges and visible aliasing.
Bilinear: Select this mode if you want to compute each output pixel by linearly blending the four nearest input pixels along x and y. This yields smoother results with fewer jagged edges but slightly blurs fine details and textures. Used for resizing natural images in classification, detection, or tracking.Setting the Properties of Local Camera Video Track Node
Local Camera Video Track Node Properties Unit Unit Name: Displays the name for the unit. This parameter is not editable.
Unit Description: Displays the description of the unit.Node Enabled: Turn the radio button ON or OFF to enable or disable the node respectively.
Node Name: Enter the name you want to assign to the node.Inputs Input: Displays the connection status of the video track node.
Quality: Select the quality (bits per pixel) at which you want to stream the live video.
Persist: Displays the output sample.
Note:Disabling the Persist option enables real-time video streaming without saving the footage. As a result, replaying or rewinding the video will not be possible. This configuration is optimal for real-time model evaluation when video storage is not required.Setting the Properties of Cast
Cast Node Properties Unit Unit Name: Displays the name for the unit. This parameter is not editable.
Unit Description: Displays the description of the unit.Node Enabled: Turn the radio button ON or OFF to enable or disable the node respectively.
Node Name: Enter the name you want to assign to the node.Inputs Input: Displays the connection status of the node.
Output Type: Select the target data type for conversion.Setting the Properties of Model Node
Model Node Properties Unit Unit Name: Displays the name for the unit. This parameter is not editable.
Unit Description: Displays the description of the unit.Node Enabled: Turn the radio button ON or OFF to enable or disable the node respectively.
Node Name: Enter the name you want to assign to the node.Inputs Input: Displays the connection status of the node.
File: Click the three horizontal dots to browse and select the TensorFlow Lite model you want to evaluate.
Arena size: Set the size of the TensorFlow Lite Micro Arena buffer size. To know more, see TensorFlow Lite Micro Documentation.Setting the Properties of Dequantize Node
Dequantize Node Properties Unit Unit Name: Displays the name for the unit. This parameter is not editable.
Unit Description: Displays the description of the unit.Node Enabled: Turn the radio button ON or OFF to enable or disable the node respectively.
Node Name: Enter the name you want to assign to the node.Inputs Input: Displays the connection status of the node.
Output Type: Select the desired output type. By default, Float32 is selected.Setting the Properties of Bounding Box Filter Node
Bounding Box Filter Node Properties Unit Unit Name: Displays the name for the unit. This parameter is not editable.
Unit Description: Displays the description of the unit.Node Enabled: Turn the radio button ON or OFF to enable or disable the node respectively.
Node Name: Enter the name you want to assign to the node.Inputs Input: Displays the connection status of the Image Resize node.
Max detections: Enter the number of maximum detections per inference.
Threshold: Enter the required confidence for the detection to pass the filter.
IOU Threshold: Enter the The IOU threshold. (Intersection over Union) threshold is the Non-Maximum Suppression (NMS) post-processing step is used to determine which bounding boxes to keep or discard. It measures the overlap between two boxes. If the IoU between two boxes exceeds the threshold, the box with the lower confidence score is discarded, keeping only the most confident detection. This helps eliminate redundant or overlapping predictions, ensuring cleaner and more accurate results.
A higher IoU score means the predicted box closely matches the actual object, while a lower score indicates less overlap. Typically, IoU thresholds (such as 0.5) are used to determine if a detection is considered correct during both training and evaluation.
Include Detected Flag: Enable this option to include a validity flag to each detection: 0 indicates a valid detection; 1 indicates padding. By default, this option is disabled.
Note: It is recommended to disable the Include Detected Flag when evaluating the model in the Graph UX. However, if you plan to deploy the model onto the board using the vision code example, enable the flag during code generation.Setting the Properties of Bounding Box Track
Bounding Box Track Properties Unit Unit Name: Displays the name for the unit. This parameter is not editable.
Unit Description: Displays the description of the unit.Node Enabled: Turn the radio button ON or OFF to enable or disable the node respectively.
Node Name: Enter the name you want to assign to the node.Inputs Input: Displays the connection status of the Image Resize node.
Threshold: Enter the threshold value below which the bounding boxes will be ignored.-
After you set the parameters, navigate to the toolbar and click the Start button to open the session file (live.imsession). An empty session file opens displaying the tracks.
-
Click the Record button to start real-time model evaluation. As the video streams, the model will identify the trained classes and draw bounding boxes around each detected class in the video.
-
Click the Record button to stop evaluating the model.
-
The bounding boxes are rendered on the live streaming video but are not embedded in the recorded video. Consequently, when the live stream is stopped and the video is replayed, the bounding boxes will not be visible.
After evaluating the model, refer to Code Generation for Vision Modelto know the code generation steps.