Graph UX Overview
Before you start working with Graph UX, it is important to understand the basic concepts, different components, and terminologies related to Graph UX.
Node Explorer
The Node Explorer window contains two directories: Library and Boards.
Library
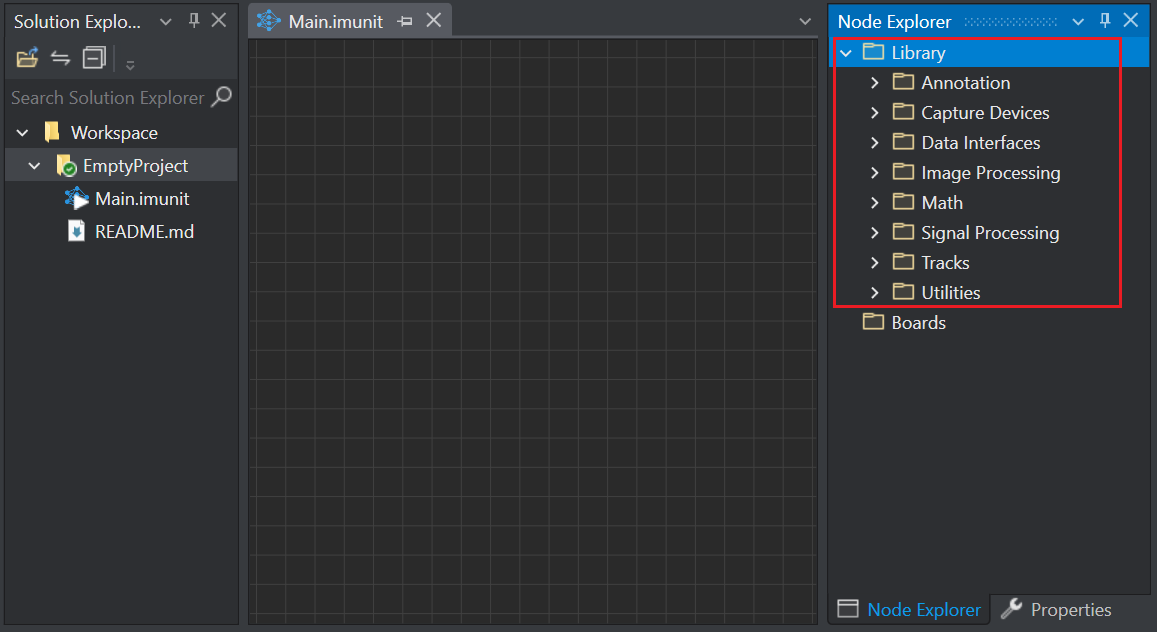
The Library includes several sub-folders each containing various components that represent a machine learning workflow on a graphical canvas. You can browse through the Library by expanding directories and exploring different units. The Library consists of the following directories:
-
Annotation: contains the Labels and Predefined Labels units for labeling data.
-
Capture Devices: contains the data collection units, such as Local Camera, Local Microphone and Serial Capture for collecting the real-time video, audio and sensor data respectively.
-
Data Interfaces: contains different Input types and output types units.
– Input Types: contain the input connector units
– Output Types: contain the output connector units -
Image Processing: contain different units for Image manipulation and Spatial transformations. These units can be used for 2d data (height, width) and (height, width, channels).
– Image Manipulation: contain operations that can modify the image
– Spatial Transformations: contain operations that can modify the shape of the video while preserving the image. -
Math: contains a wide range of math functions units for different operations.
– Element Wise: contain operations that can be used on all the elements in the tensor
– Multi-Tensor Operations: contain operations that can be used betweem two tensors
– Slicing and Shaping: contain operations for organizing the structures of the tensors
– Statistics: contain operations that describe larger patterns in a window of data
– Tensor Reductions: contain operations that collapse a dimension into one value -
Signal Processing: contain different signal processing units for Frequency domain, Postprocessing, Spectral Utilities and Time Domain.
– Frequency Domain: contain operations for the frequency domain
– Postprocessing: contain operations for improving the model predictions by using filter or some logic
– Spectral Utilities: contain miscellaneous signal processing operations
– Time Domain: contain operations for the time domain -
Tracks: contains Data Track, Label Track and Video Track units to visualize the output of the graph.
-
Utilities: contains Expressions and Quantization units:
– Expressions: contain the constant and expression units, with the expressions written in Imagimob Domain Specific Language (DSL). Using these units, you can create custom expressions in the graph. Refer to Creating custom layers or functions for more information.
– Quantization: contains quantization units for reducing the memory of a pipeline.
If the Node Explorer Window is not open by default, navigate to View> Node Explorer to access the window.
Boards
When you connect the board to DEEPCRAFT™ Studio, the name of the board and all configured sensors will be displayed under the Boards directory.
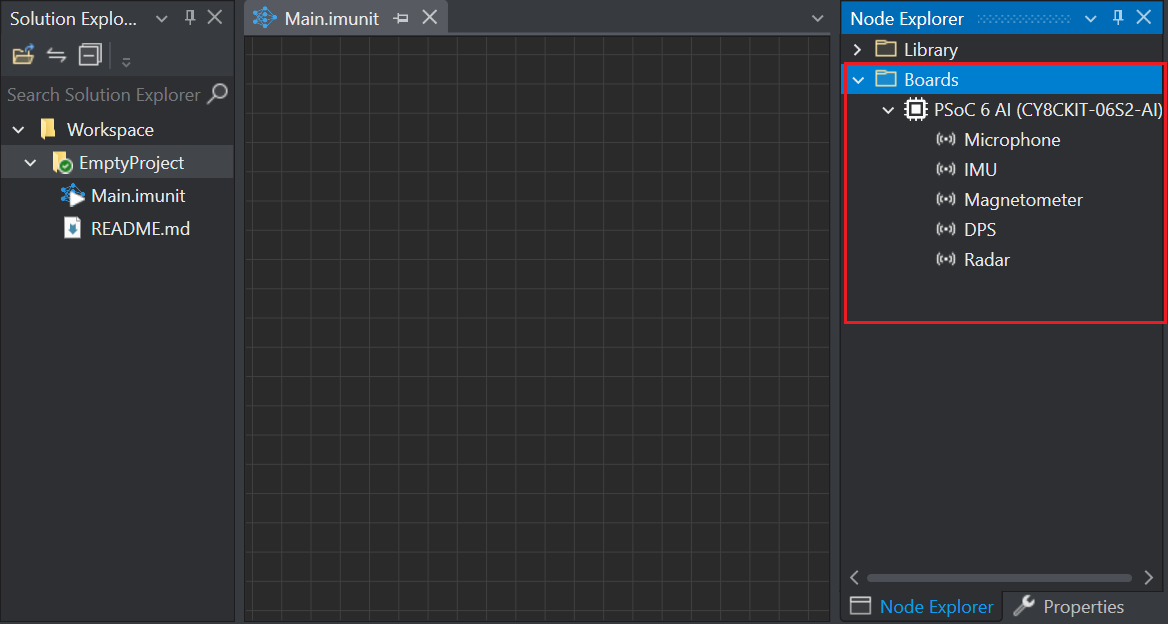
The Boards directory is displayed only when the board is flashed with new Streaming firmware/ Protocol version 2 and Use Node Explorer with Protocol Version 2 option is enabled under Tools> Options> General.
Canvas
A Canvas is an working area where you create or edit a machine learning graph to use different functionality in Graph UX. You can work on multiple canvasas, save your current one to work on the new canvas. There can be one or more instances of a single unit on a canvas.
Canvas Properties
-
Opening Canvas: Expand GraphUX Project and double-click main.imunit to open a canvas.
-
Zooming Canvas: zoom-in and zoom-out the canvas by scrolling the wheel of the mouse.
-
Saving Canvas: Navigate to File and select Save Main.unit As to save a canvas.
Main unit (Main.imunit)
Main unit is the root unit or node that can only be executed in a project. The canvas of the main unit can contain any number of nodes and subgraphs. When you run the main unit all the active and connected graphs get executed.
Unit (.imunit)
A unit is a function or operation that can be dragged from the solution explorer and dropped on the canvas. When you drag a unit from solution explorer and drop on the canvas, the unit is called a node. There can be one or more instances (nodes) of a single unit. All the function or operation that are listed in the librray and can be dragged and dropped on the canvas are units.
Node
A node is a building block of a graph that provides one or more functions and perform computation when executed. Nodes are connected to other nodes to form a machine learning graph.
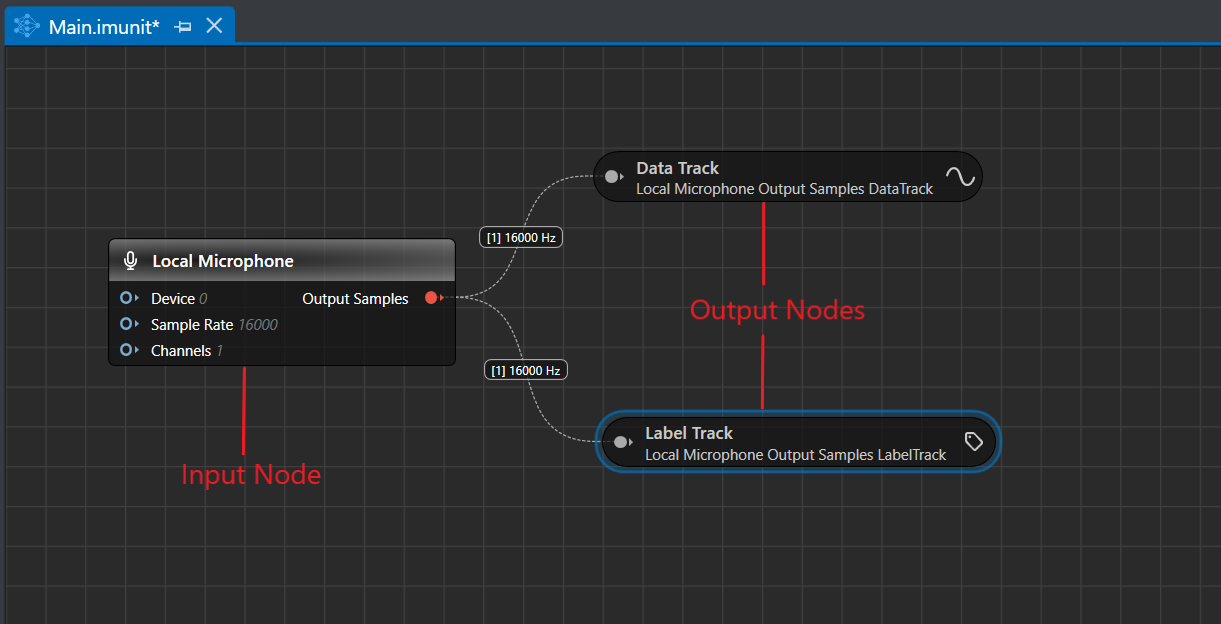
There are two types of nodes:
-
Input node
-
Output node
A Input node is designed to collect data from various external sources, such as local microphone, sensors and files and pass on the data to other nodes in the graph. These nodes are placed at beginning of the graph. A graph can have multiple input nodes but only one node active at a time.
A Output node is designed to help in visualizing the final outcome from the graph, for instance, the predictions of a machine learning model. These nodes are generally placed at the end of the graph. The output from the graph can be visualized in single or multiple output nodes.
Depending on the type, a node can have multiple Input or Output ports. The Input Ports are on the left side and the Output Ports are on the right side of Nodes, creating the flow of data from left to right.
Node Properties
-
Searching and adding nodes to the canvas: Use the Node Explorer search box to find a node then drag and drop the node from the search results onto the canvas. You can also double-click on the canvas or right-click on the canvas and select Search for Node to open the search bar. You can also press Ctrl+T when the .imunit window is active. Type the name of the node, then either double-click the matching result or drag and drop the node onto the canvas. You can hover over the units in the search list to view the description of the node.
-
Adding Node to Canvas: Drag a unit from solution explorer and drop onto the canvas to convert a unit into a node. There can be one or more instances of a single unit on a canvas.
-
Viewing or setting Node Properties: Click on the Node to view or set Node Properties.
-
Copy Node: Right-click on the node and select Copy and Paste a node in the graph.
-
Disabling or Enabling Node: Right-click on the node and select Disable or Enable to make a node active or inactive in a graph respectively.
-
Deleting Node: Right-click on the node and select Delete to remove a node from the graph.
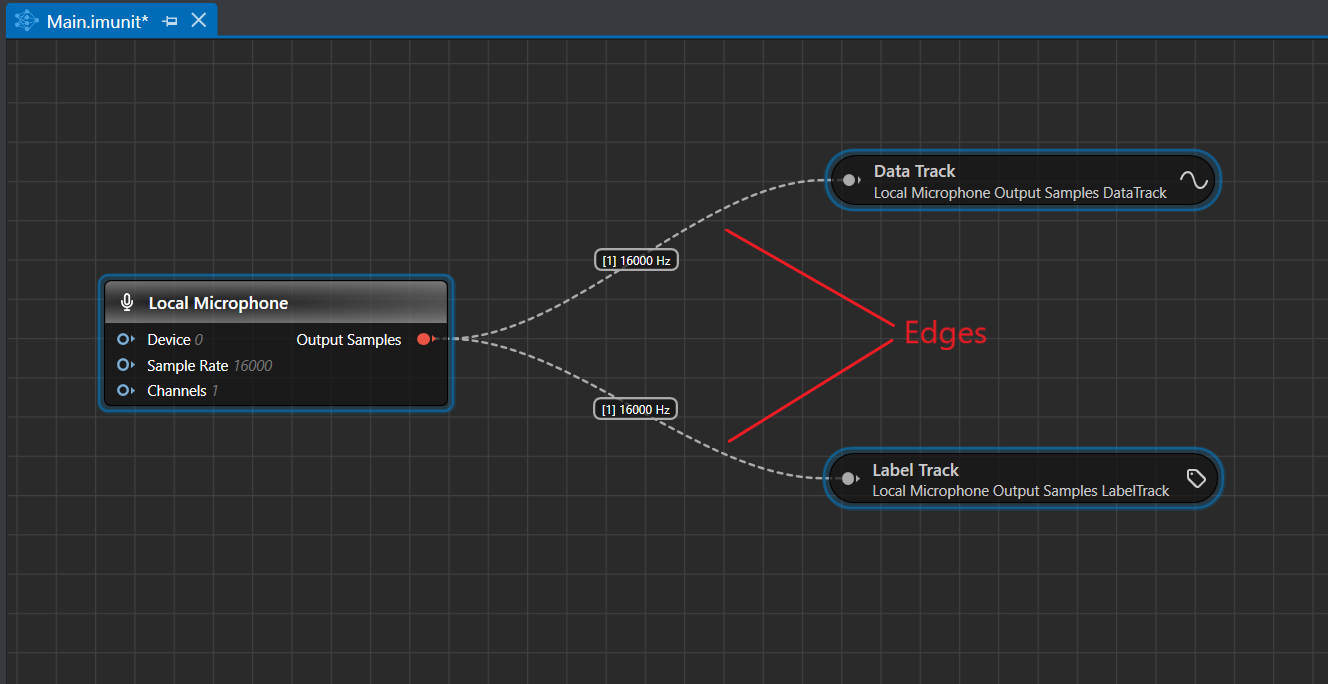
Edges
Edges are the curved lines that connects one node to another node in a graph. An edge displays the shape (within brackets ’[]’) and frequency, representing the data that will flow through the connection when the graph runs. If a node is connected to a node which cannot process the incoming data of the specified shape and frequency, the receiving node shows an error.
Edge Properties
- Creating Edges:Hold-and-drag the output of one node to connect to the input of another node. This creates a connection between the two nodes.
- Deleting Edges: Right-click on the edge and select Delete to remove the connection between the two nodes.
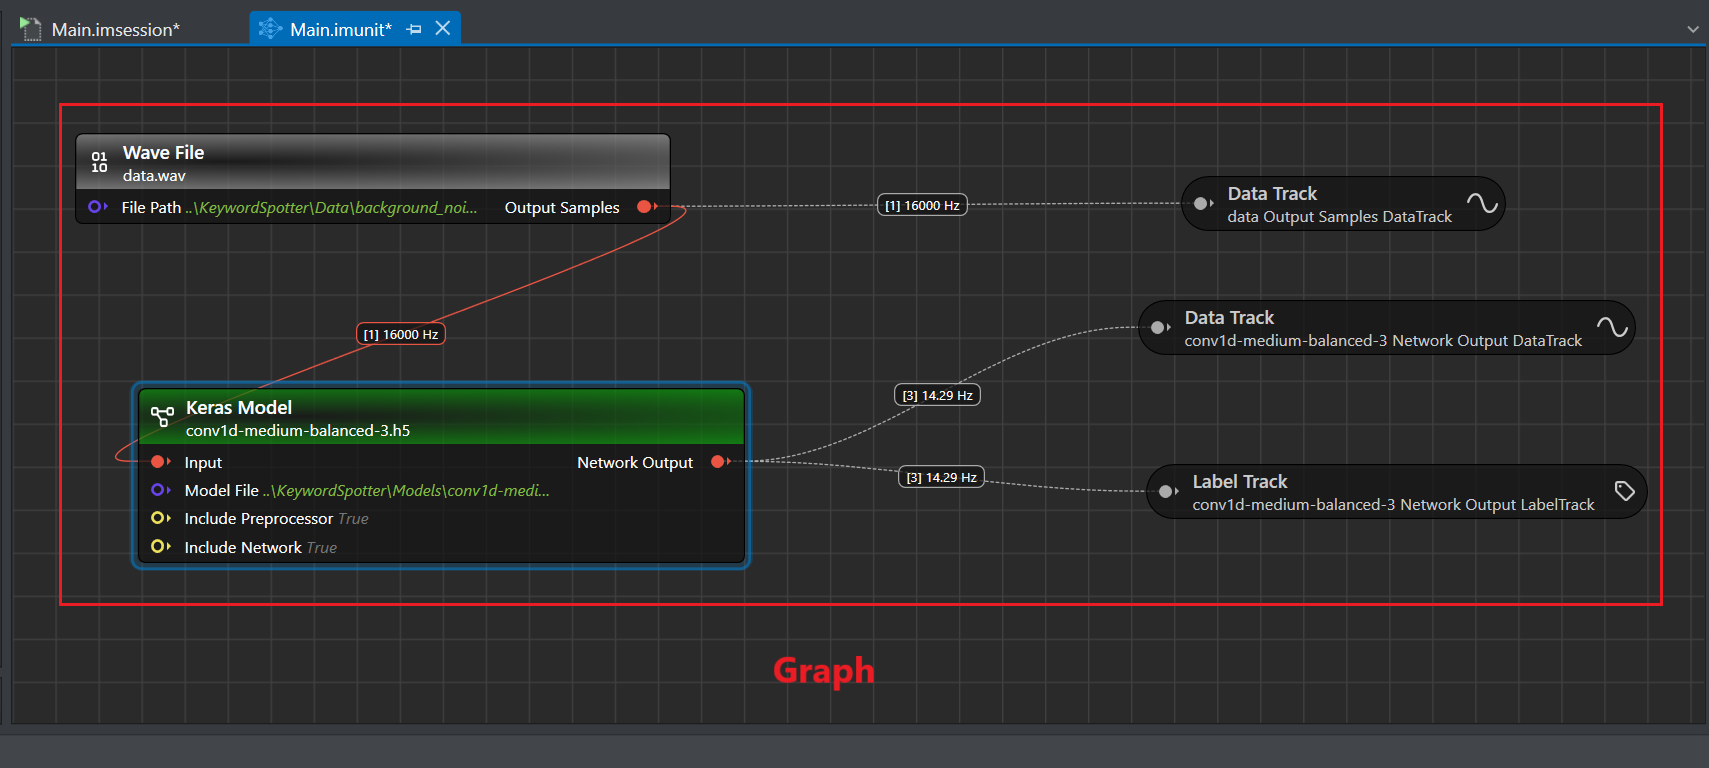
Graph
A graph is a collection of nodes and edges, where edges are the connections between the two nodes. Graphs are used to represent the end-to-end machine learning workflow in a graphical form that helps in analyzing and visualization the various machine learning components in detail. On a canvas, you can create multiple graphs lay side-by-side.
Graph Properties
- Executing Graph: Click the Start button in the toolbar to execute a graph in Graph UX.
- Generating code from a graph: Click the Generate Source Code button in the toolbar to generate the code for the graph.
Sub-graph
Sub-graph is a part of a graph that includes a subset of the nodes and the edges. A Sub-graph presents the original graph in different detailed levels.For instance, double click a trained model node in the canvas to view the sub-graph that constitutes the network.
Sub-graph Properties
-
Break graph into Sub-graph: Click the Start button in the toolbar to execute a graph in Graph UX.
-
Convert to Editable Units: Right-click on the Keras model node and select Convert to Editable Units to view the the Keras model node in detail.