Evaluating model using Graph UX
Model evaluation is a crucial step in building a machine learning model. It helps in analyzing the model performance by using multiple statistics and metrics. However, a model performing ideally in the evaluation phase may not perform as expected in real world. To address this, the model should be thoroughly evaluated before deploying. Imagimob's Graph UX supports real-time model evaluation functionality which helps in analyzing and monitoring the model predictions before deploying a model to production. It also ensures that the model generates accurate predictions on real-time data.
Creating an Evaluation Graph
To create an evaluation graph for evaluating a model, follow the steps:
Step 1: Bring the trained model onto the canvas
To bring the trained model onto the canvas, follow the steps:
- Double-click the Main.imunit to open the canvas.
- Expand Project and drag and drop the Keras Model unit onto the canvas.
- Click on the node to open the Properties window and define the path of the model (*.h5) file.
- Under Inputs in Model File, click the three horizontal dots to select the model file that is trained in Imagimob Cloud.
- The path of the selected model file is reflected in the Model File node and in the Properties window.
You can also navigate to the project directory and drag and drop the trained model file (.h5) onto the canvas.
Step 2: Select Input node to stream data
Graph UX provides the flexibility to stream data using the following units as Input Node:
- Serial Capture
- Local microphone
- CSV file
- Wave file
You can set the properties as per your requirement but it is recommended to use the default settings for the input nodes.
Setting up Serial Capture
Before using the development board to evaluate the model, make sure to flash your board with Imagimob Streaming Firmware. If using Infineon PSoC™ 6 development board, refer to Getting started with Infineon PSoC™6 Wi-Fi BT Pioneer Kit and IoT sense expansion kit and for using generic development board, refer to Imagimob Streaming Protocol Specification (opens in a new tab) for detailed instructions.
To set up Serial Capture, follow the steps:
- Connect the development board to laptop or PC using the serial port.
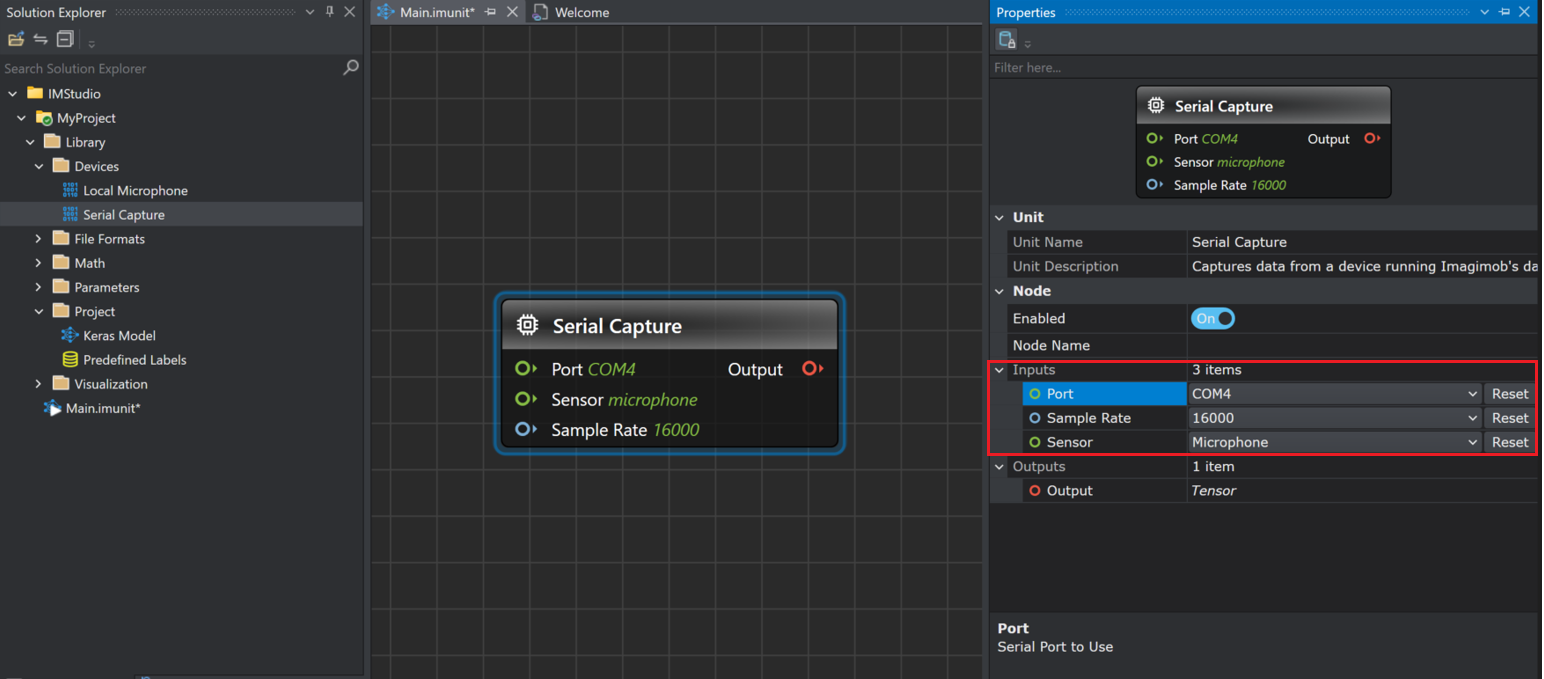
- Expand Devices and drag and drop the Serial Capture unit onto the canvas.
- Click on the node to edit the properties in the Properties window.
- Under Inputs set the following parameters:
- In Port, select the serial port on which you connect the board.
- In Sample Rate, select the required value
- In Sensor, displays the sensor type
Setting up local microphone
To set up local microphone, follow the steps:
- Connect the microphone or use the speaker of the laptop or PC.
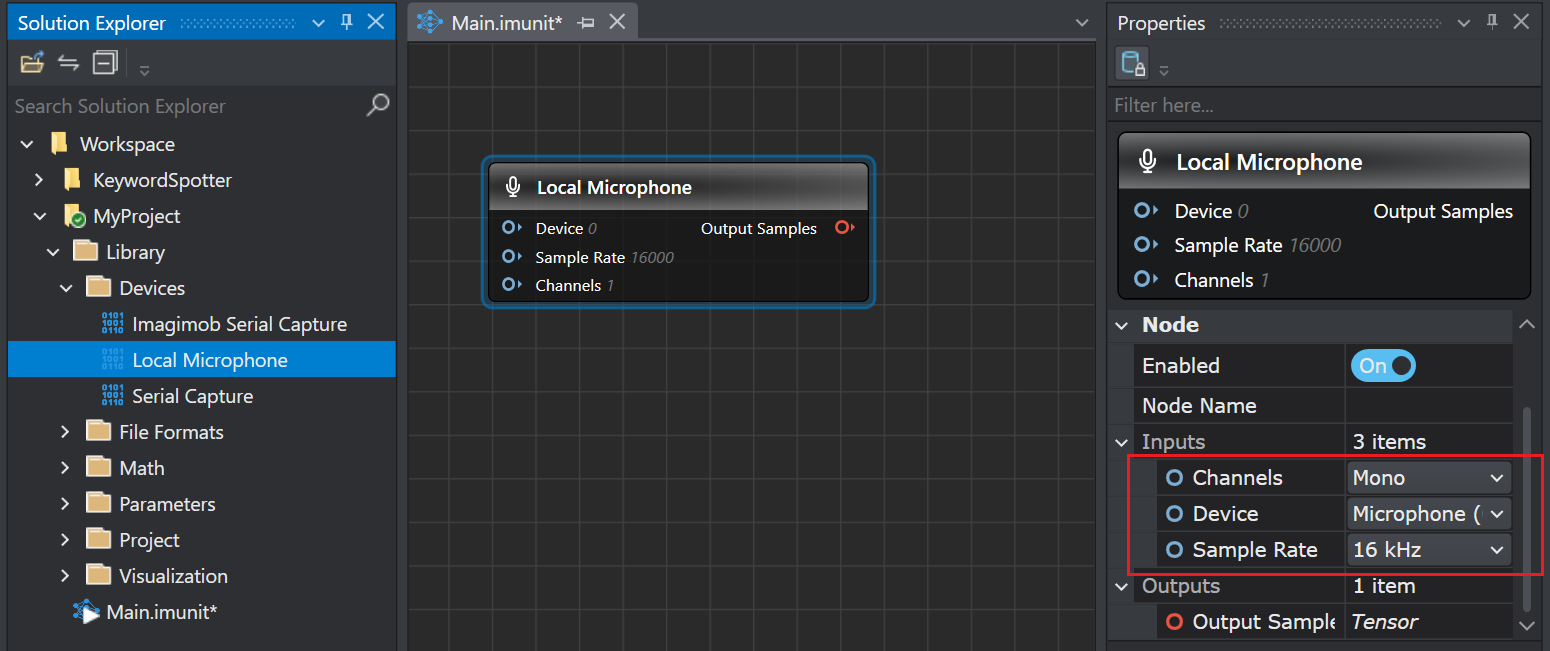
- Expand Devices and drag and drop the Local Microphone unit onto the canvas.
- Click on the node to edit the properties in the Properties window.
- Under Inputs set the following parameters:
- In Channels, select the number of channels - Mono or Stereo
- In Device, select the device that will be used for data streaming
- In Sample Rate, select the required value
Setting up Wave File
To set up Wave File, follow the steps:
- Expand File Formats and drag and drop the Wave File unit onto the canvas.
- Click on the node to open the Properties window and define the path of the wave file.
- Under Inputs in File Path, click the three horizontal dots to select the desired wave file.
- The path of the selected wave file is reflected in the Wave File node and in the Properties window.
You can also drag and drop a wave file from the Solution Explorer onto the canvas.
Graph UX supports PCM encoded wave file with a sample rate of 16 bits.
Setting the CSV File
To set up CSV File, follow the steps:
- Expand File Formats and drag and drop the CSV File unit onto the canvas.
- Click on the node to open the Properties window and define the path of the csv file.
- Under Inputs in File Path, click the three horizontal dots to select the desired csv file.
- The path of the selected wave file is reflected in the CSV File node and in the Properties window.
You can also drag and drop a csv file from the Solution Explorer onto the canvas.
Graph UX supports csv file with timestamps.
Step 3: Setting up Visualization nodes and connecting different nodes
To set up the visualization nodes and connecting different nodes , follow the steps:
- Expand Visualization and drag and drop one Label Track and two Data Tracks unit onto the canvas. The visualization nodes helps in viewing and analysing the model predictions.
- Click on the visualization nodes to open the Properties window and set the properties, if required.
- Click on the red output icon present in the Input Node and drag over to the red input icon in the Data Track node. The output from the input node can be visualized in the Data Track node.
- Click on the red output icon present in the Input Node and drag over to the red input icon in the Model Node. The output from the input node is fed into the model creating a connection between the two nodes.
- Click on the red network output icon present in the Model Node and drag over to the gray icon in the Data Track. The output from the model is fed into the data track helping in visualization the model predictions.
- Click on the red network output icon present in the Model Node and drag over to the gray icon in the Label Track. The output from the model is fed into the label track helping in better visualization the model predictions as generated labels.
Generate predictions to evaluate the model
To generate predictions to evaluate the model, follow the steps:
- Navigate to the toolbar and click the Start button to open the session file (.imsession). An empty session file opens displaying the different tracks in timeline.
- Click the Record button and speak into the local microphone or sensors on the board to start the data streaming, when using Serial Capture or Local microphone as an Input node. Click the Play button to start data streaming, when using Wave or CSV file as an Input node.
- Based on the real-time data streaming, the model starts to make predictions.
- Capture the model predictions data for few seconds.
- Click the Record button to stop data streaming and model predictions. If you are streaming data using Wave or Csv file, click the Stop button. After evaluating the model performance on the real-time data, you can make a decision to deploy or further train the model. You can save the generated predictions as dataset for improving the model.
- Select File>Save Main.session As, if you only want to the save the session file. However, select File>Save to save all the files in the timeline. The Save New Session window appears.
- In location, click the three dot and select the desired location to save the file.
- In Session Name, enter the name of the session file.
- In Track options, select the save checkbox corresponding to the tracks you want to save. You can also edit the track name and file name by double clicking the respective columns.
- Click OK to save the files.