Overview of Data Tab
This section provides an overview of the Data tab within a project file. The Data tab provides the flexibility to organize and manage data using different data management functionalities.
The Data tab is segmented into different panes to facilitate seamless data management.
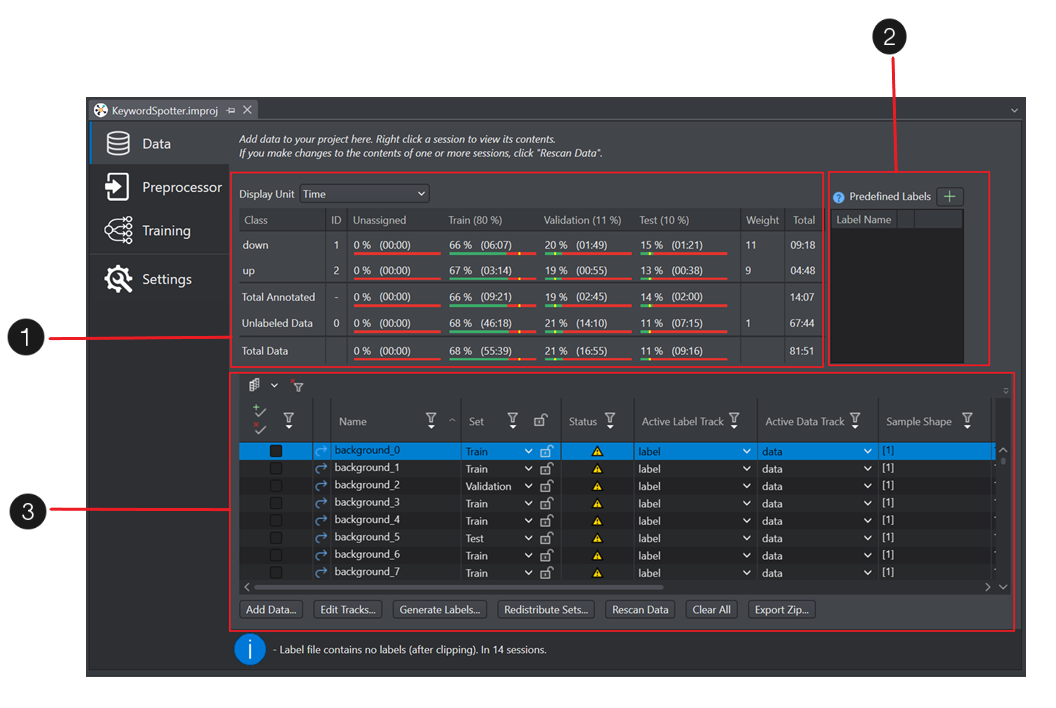
The table below shows the different panes in the Data tab:
| Panes | Description | |
|---|---|---|
| 1 | Data Summary Pane | The Data Summary pane displays a concise data summary that provides insights about data distribution, balanced and unbalanced datasets and other data statistics. |
| 2 | Predefined Labels Pane | You can predefine the classes in the Predefined Labels pane for projects and use the pre-defined labels to annotate the data in the session files, refer Manual Labeling to know more. |
| 3 | Data Pane | The Data pane lists the session files and the session related details in a tabular format. You can customize the data pane and focus on the required datasets. |
Working with Data Pane
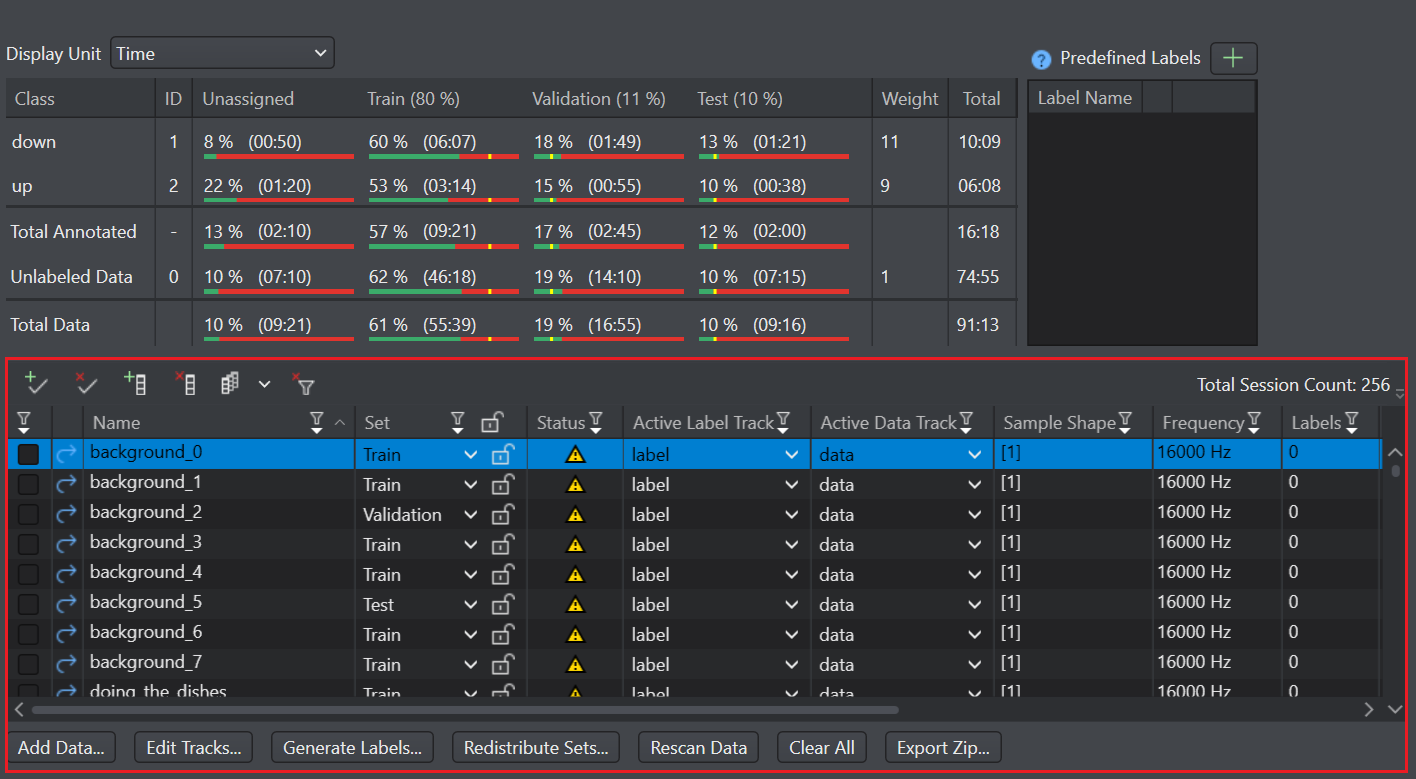
The Data pane lists the session files and the parameters associated with the session files, providing insights about the imported data in a tabular form. The Data pane provides advanced features to organize and manage your data in the project file, such as:
- Auto-Generated Columns
- Custom Columns
- Filtering
- Sorting
- Show/Hide Columns
Columns in Data Pane Table
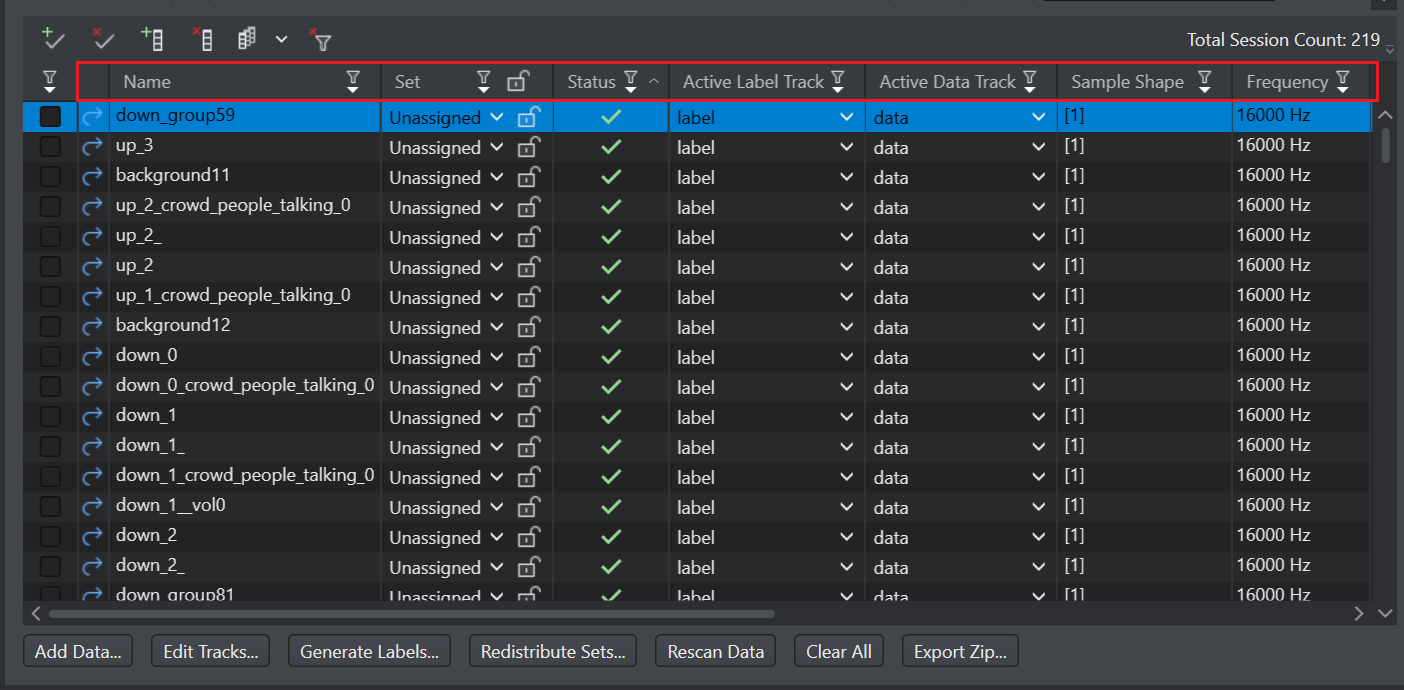
The Data Pane includes the following columns:
- Name: Displays the name of the session file that contains the data and the label tracks, by default. Double-click or right-click> open on the session name to open and view the session file. The label track and the data track displayed in the session file is listed in the Active Label Track and Active Data Track columns respectively.
- In Classic UX project, for each data file or data-label file pair imported into project, a session file is generated automatically whereas in Graph UX project, a session file is created automatically, when collecting real-time data in Studio.
- In Classic UX, name of the session file is the name of the folder in which the data file or data-label file pair is placed whereas in Graph UX project, name of the session file is the date and time at which the data is collected. However, you can change the name of session file, if required.
-
Set: Displays the dataset to which the corresponding session is assigned. You can assign the session to the Train, Validate and Test dataset using the drop-down menu or Redistribute Sets button.
The Redistribute Sets button distribute the selected sessions into the different datasets based on the percentage defined in the Redistribute Data Tool. However, the sessions are assigned to the different datasets in random fashion. You can use the drop-down menu to assign sessions into the desired dataset one at a time. You can use the lock icon to keep the session assigned in the selected dataset. Using the locking functionality, will not change the dataset for the session, even when you use Redistribute Data Tool. By default, no session is assigned to any dataset. To know about the datasets, refer to Data Distribution.
-
Status: Displays the error or warning symbols as well as the message for the data and the label files corresponding to the session file. The error or warning message is displayed at the bottom of the Data Tab.
-
Active Label Track: Displays the label tracks corresponding to the session file. Select the label track to be used for training from the drop-down. A session file can contains multiple label tracks.
-
Active Data Track: Displays the data tracks corresponding to the session file. Select the data track to be used for training from the drop-down. You can train the model using the raw data, preprocessed data or predictions from the trained model.
-
Sample Shape: Displays the number of dimensions and size of each dimension.
-
Frequency: Displays the sampling frequency at which data is collected.
-
Labels: Displays the number of labels in the active label track.
-
Length: Displays the length of the active data track in time.
-
Labelled: Displays the total labelled time in the active label track.
-
Labelled(%): Displays the length (time) of the active data track that is labelled in terms of percentage (rounding off to the nearest integer).
-
Classes: Displays the different classes defined in the label track as columns. The class column shows the count of labels with that class in the label track. For example, in a keyword spotter project, the columns Up and Down are displayed.
-
Delete: Click the red-cross icon to delete the session file from the project.
The above described columns are populated automatically, when you import data into the Studio. However, you can add additional columns to the data pane table. This can be done by either using the Auto-Generated columns or Custom Columns feature.
The columns Labels, Length, Labelled,Labelled (%), and Classes are not displayed for the regression projects.
Auto-Generated Columns
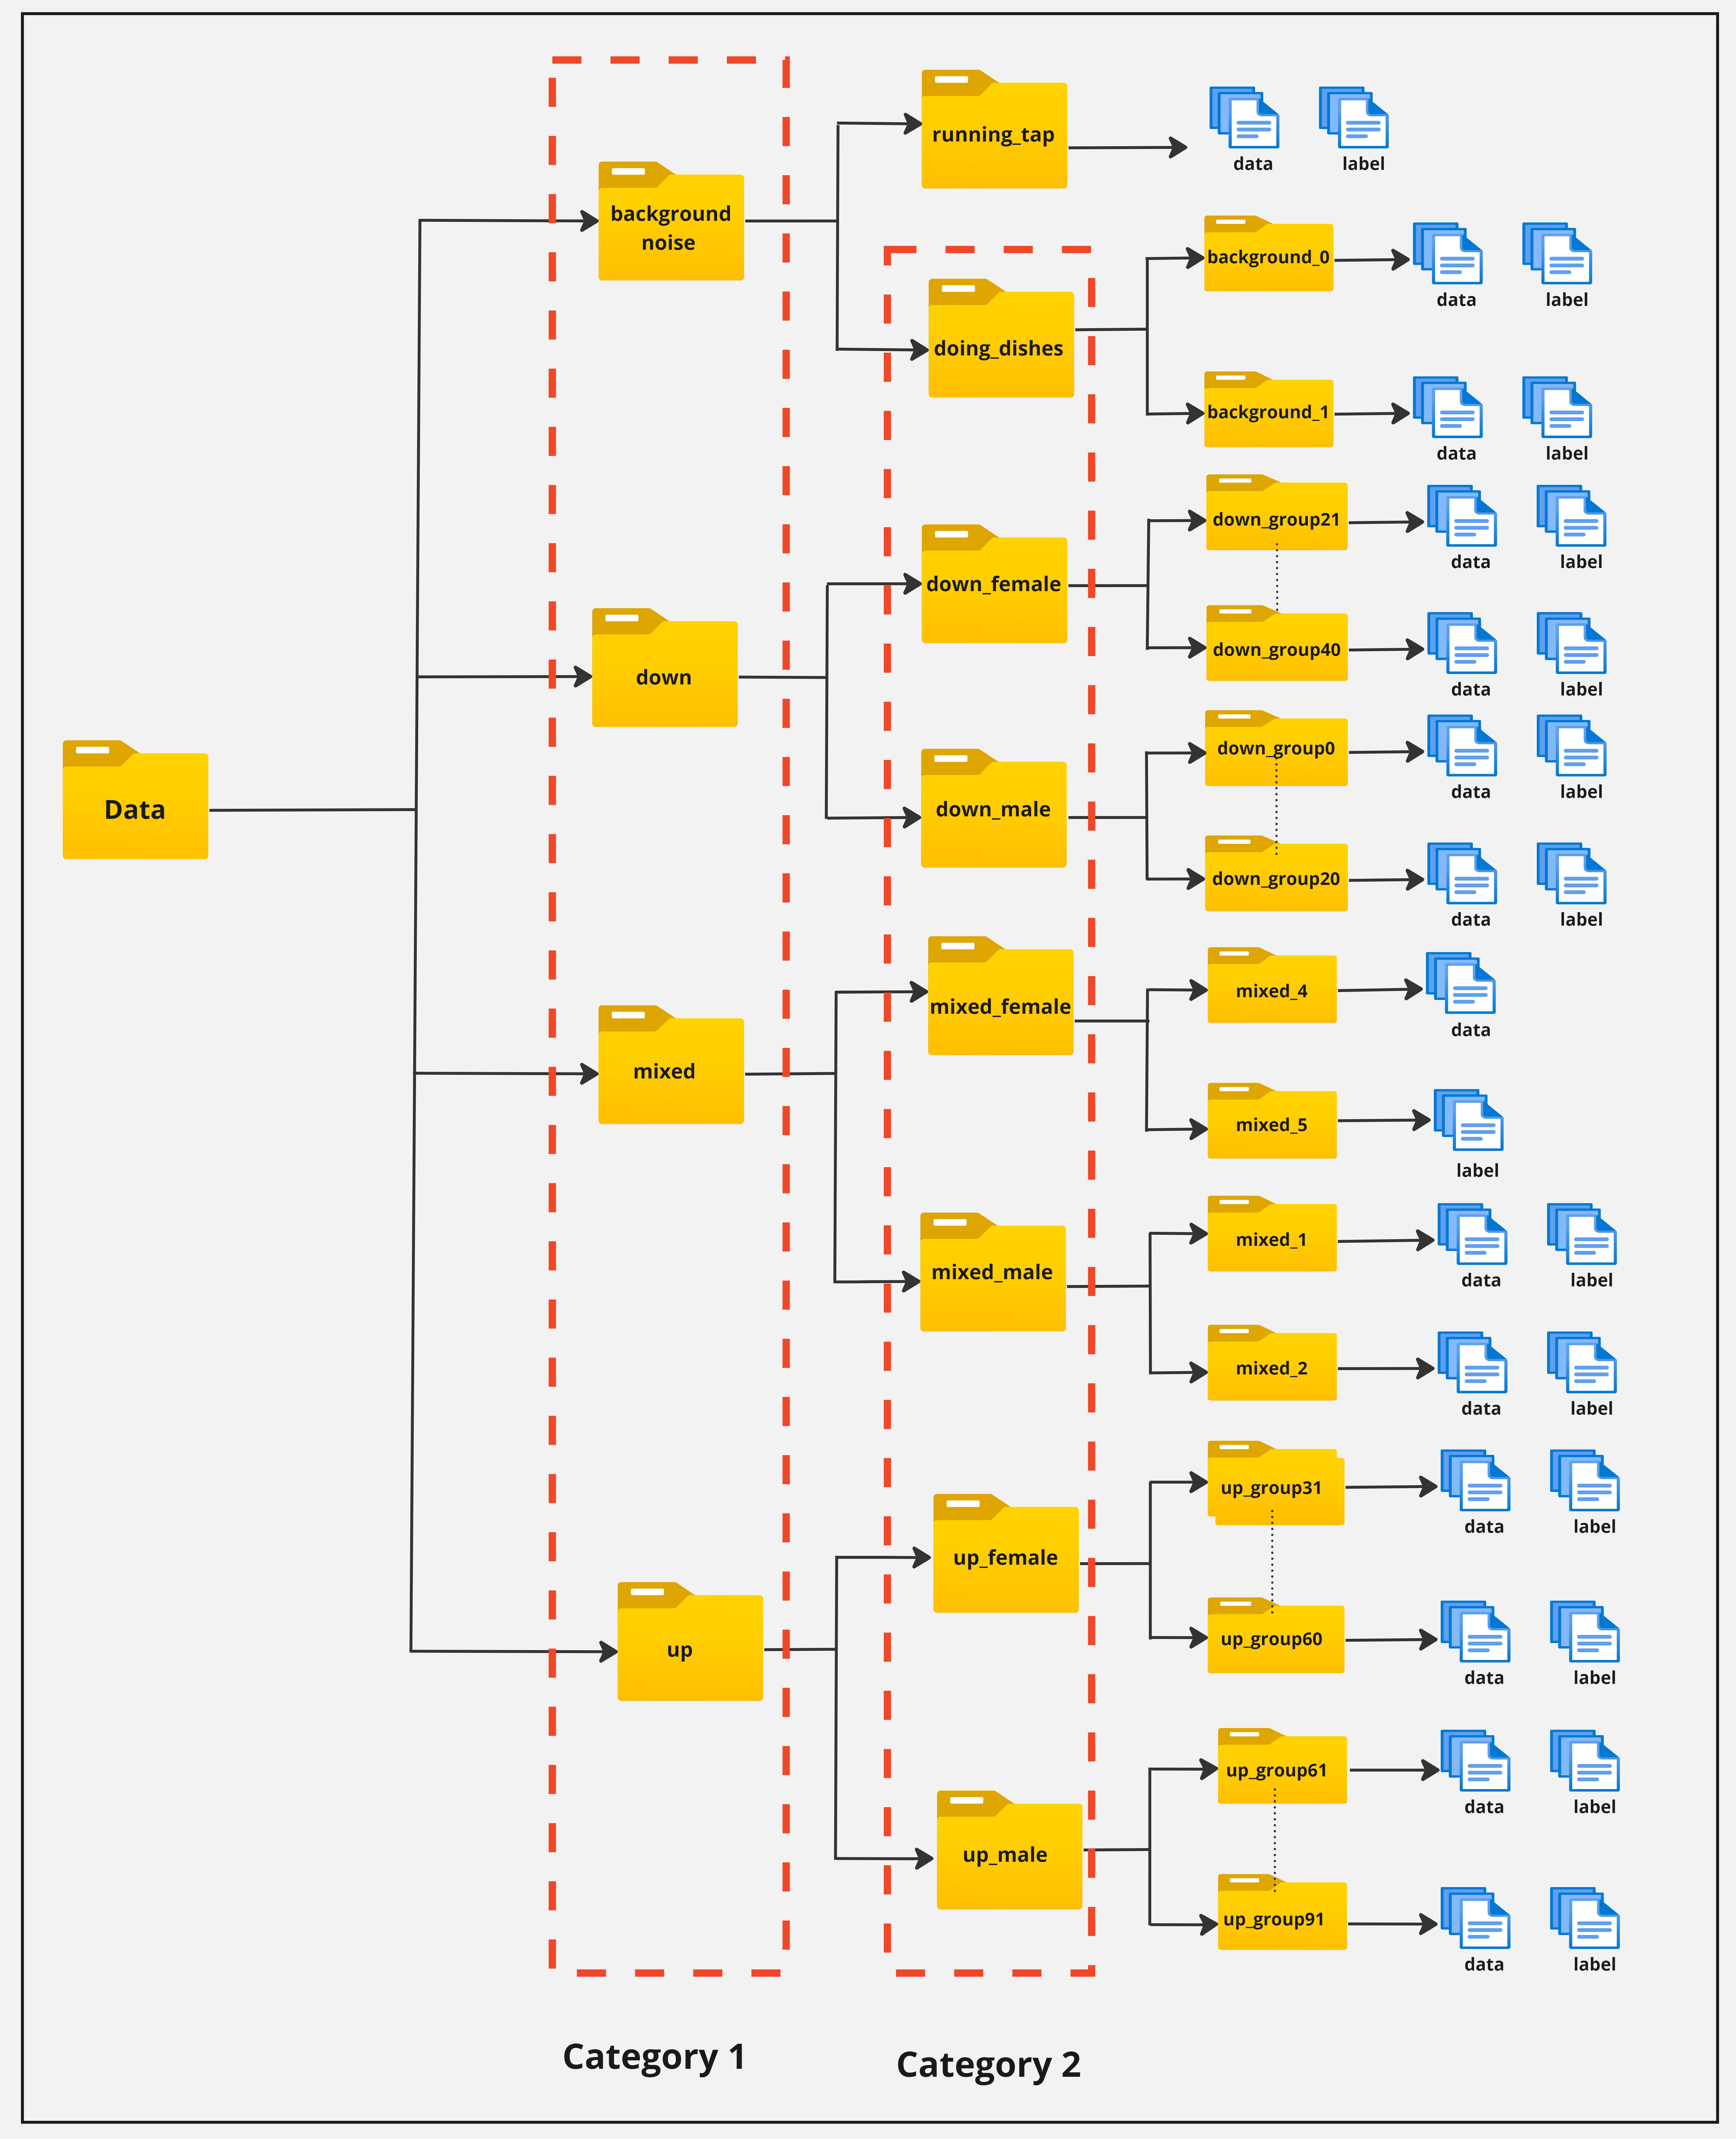
Auto-generated columns are the additional columns that are created based on the hierarchy of the Data folder. The columns are created based on the folder structure of the Data folder. The first level of folders inside the Data folder are created as category 1 column, the second level of folders are created as category 2 column and so on. The last level of folders in which the data (.wav,.csv) or label (.label) files are placed are not generated as columns. These columns are generated automatically when you import data into the Studio.
Lets understand the scenarios in which the auto-Generated columns can really make a difference when dealing with data.
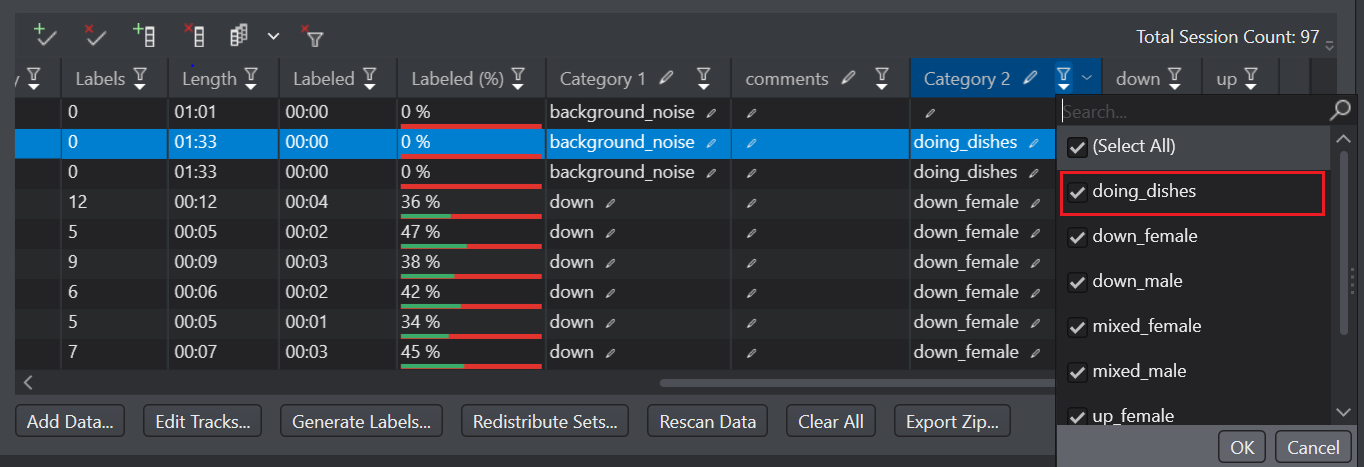
For instance, you are working on the Keyword spotter project, and you want to build a robust model by training the model on the variety of the data. After collecting data, you place the data in a organised way by creating different folders for different type of data as depicted in the image above. Say, you create first level of folders as background_noise, down, mixed and up, further dividing the data in the background_noise folder into running_tap folder and doing_dishes folder, up folder into up_male voice folder and up_female voice folder, down folder into down_male voice folder and down_female voice folder, mixed folder into mixed_male voice folder and mixed_female voice folder, and further dividing the folders to place the label and/or data file in a nested fashion. On importing this data folder into Studio, first level of folders will be created as category 1 column and second level of folders will be created as category 2 column. Now, if want to train as well as test the model on negative data, say background_noise specifically on the doing_dishes, simply filter the category 2 column on doing_dishes and assign some data to train and test dataset in the data pane. This way you can properly distribute data into the required dataset within no time.
Second scenario can be dividing the Data folder into Train, Test and Validation folders and placing the data on which you want to test, train and Validate the model in the respective folder. Now, you can simply filter and assign the train data to the Train dataset, test data to the Test dataset and Validate data to the Validation dataset. This will help you in bulk assigning the data into the respective dataset.
The auto-generated columns feature can be used to the full potential by organising the data in the right way, providing transparency and control to manage the data when building the model.
Custom Columns
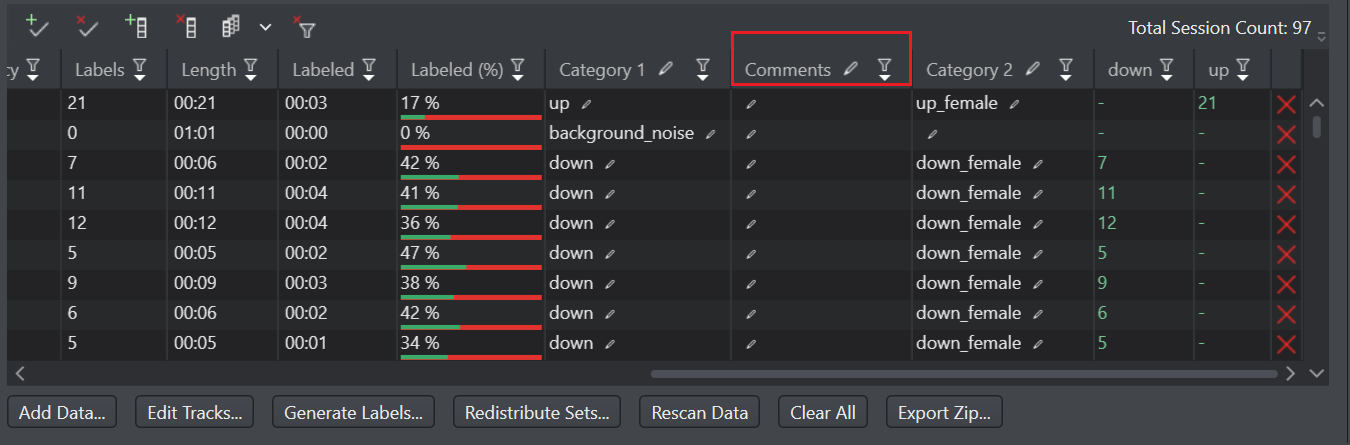
Studio provides you a way to add custom columns to the existing columns in the data pane table. This will help in analyzing and managing data more efficiently. For instance, you can create a ‘comments’ column in the existing table and add relevant information for your use.
Create Custom Column
To create a custom column, follow these steps:
-
Click
 Add New Custom Column icon. The Add New Column window appears.
 -
In New Column Name, enter the name of the column.
-
Click OK to create the new column. A new column is created before the class columns in the table.
You can edit the column name by clicking on the pencil icon, whenever required. Similarly, you can create multiple custom columns.
Set value in Custom Column
You can set the values in the custom columns one at a time or instantly. You can add text or numeric values in the custom columns.
To set the distant value in the custom columns one at a time:
- Click the pencil icon in the columns you want to add a value.
- Enter the required value.
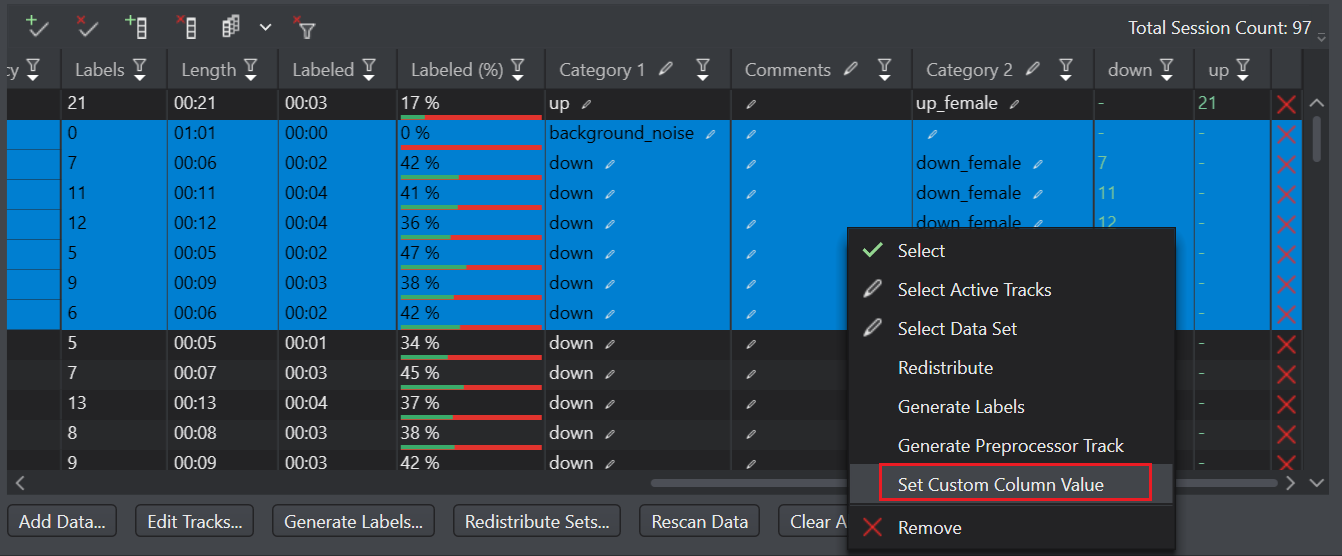
To set the same value in the custom columns instantly:
- Click and hold the shift key to select the columns in which you want to assign the value.
- Right-click and select Set Custom Column Value from the list of options. The Set Custom Column Value window appears.
- In Value, enter the required value and click Ok. The value is added in the selected columns.
Delete Custom Columns
You can delete auto generated as well as custom columns from the table.
-
Click
 Delete Custom Column icon. The Delete Custom Column window appears.
 -
In Delete Custom Column, select the custom column you want to delete from the drop-down list.
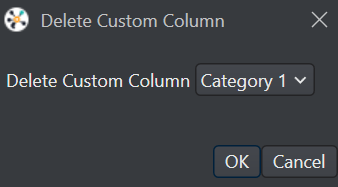
-
Click OK to delete the column.
Using the above steps, you can also delete the auto-generated columns.
Customize your view in Data Pane
You can customize the Data Pane by hiding, sorting and filtering the data in the columns.
Show or Hide columns
To show or hide the columns, follow the steps:
- Click
 Show/Hide Columns icon to view the list of all the columns in the table. By default, all the columns are visible.
 - Disable the toggle button against the columns name you want to hide.
- To show the columns, enable the toggle button against the columns name you want to view.
You can also search the name of the columns you want to show or hide using the search bar.
Sort columns
You can sort the columns alphabetically or numerically in ascending or descending order. To sort the columns, follow the steps:
- Click the column header of the column you want to sort. The column is
- Click the column header again to toggle the sorting order.
The column header displays an arrow icon to indicate that the data is sorted by the column.
Apply filters on columns
You can filter the columns and analyze the data in which you are interested. To apply filters on columns, follow the steps:
- Click the
 Column header filter icon for the column you want to filter.
 - Search the filter keyword you want to view in the search bar. The list displays the matching results. You can unselect the checkboxes against the data you do not want to view, if required.
- Click Ok to apply the filter. The selected items appear on the list.
You can also apply multiple filters in the same or different columns at the same time.
Select or Deselect all session files in the table
After using the filters, you can select or deselect the filtered sessions.
Click the Select or Deselect icon to select or deselect all the sessions files respectively.
Clear Filter
To clear the filter, follow the steps:
- Click the Column header filter icon for the column you want to remove the filter.
- Clear the search text and select the Select All checkbox (if unchecked).
- Click Ok to remove the filter.
Clear all Filters
Click the  Clear All Filters icon to remove the filters from all the columns the table.
Data Management Functionalities
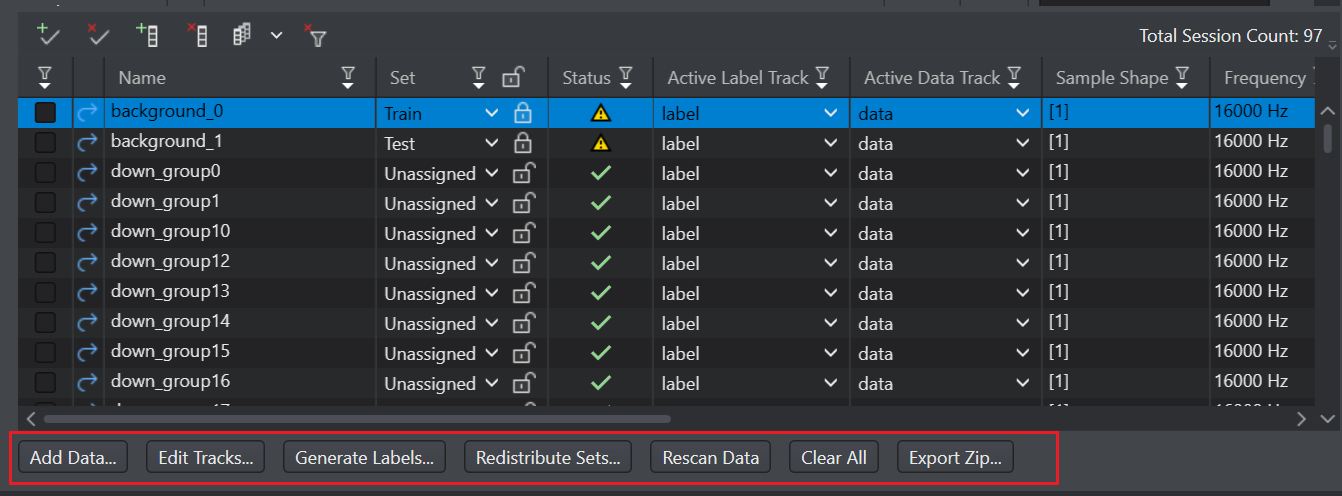
The Data Tab provides the following buttons to perform different operations on the data:
-
The Add data button allows you to import data into the project, refer Bring your own data to know more.
-
The Merge button allows you to merge the prediction and preprocessor tracks into the project, refer Importing predictions and Importing preprocessing tracks to know more.
-
The Edit tracks button allows you to edit the tracks.
-
The Generate labels button allows you to generate the labels for all the sessions. You can use the filtering functionality to generate labels for selective sessions, if required. You can generate labels using an existing label track or a pre-trained model. To know how to generate labels using pre-trained model, refer to ML-assisted labeling.
-
The Redistribute Sets button allows you to re-distribute all the datasets to the train, validation and test datasets. You can use the filtering functionality to redistribute selective datasets. To know more about redistributing sets, refer Data Distribution.
-
The Rescan Data button allows you to perform Quick scan or Full scan on the dataset.
-
The Clear All button allows you to remove all the session files.
-
The Export Zip button allows you to export the data as a .zip file.