DEEPCRAFT™ Cough Detection Ready Model Report
In this document, we describe the DEEPCRAFT™ Ready Model for Cough Detection, an audio-based AI model developed by Imagimob, an Infineon Technologies company, that detects when there is a person coughing. We provide details about the technical specifications of this machine learning model, its performance in common scenarios, and various test results for the model including the real-time testing on an Infineon PSOC™ 6 board.
-
This model is not certified for medical use. It must not be used as a medical device or as a substitute for professional medical advice, diagnosis or treatment.
-
All recommendations, performance information, and other details mentioned in this report refer exclusively to the Ready Model included in the project. Any modification to the model — such as retraining, altering its architecture, or changing its parameters — is likely to invalidate these details, including the stated recommendations and performance metrics.
Model Specification
Model Overview
The DEEPCRAFT™ Ready Model for Cough Detection is designed to detect coughs from adults. Such a model is developed with the intent to run on a wearable device like a smart watch, a bracelet, an armband, a necklace as well as on a smartphone or other nearby non-wearable device located in the vicinity of the person. There are no limitations concerning the environment, the user can be in any location, so the model has to be robust to all typical sounds found at home, in a restaurant, or in a work environment as well as in a noisy city setting given that the environmental sound is low enough. The model will not distinguish between cough types, and its output can be the input of an application that counts cough events.
Expected Performance
The aim of this model is to detect the user’s number of coughs per hour. The model focuses on serious coughs, that is, coughs with prolonged acoustic components longer than 200 ms. Multiple subsequent coughs can be detected as one cough event. On average, the model is expected to detect 84% of the cough events at distances between 10 cm and 2 metres. The recall goes up to approximately 90% when looking at recordings from individuals who were reported as sick. In addition, the model is expected to misclassify other sounds/noise with a rate of 6 per hour. Besides different distances and angles, the model is expected to be robust against different genders, ethnicities, ages etc. as well as different negative sounds like those found in homes, workplaces, cities, etc. A cough event, compared to its background, needs to have a Signal To Noise Ratio (SNR) of at least 10 decibels (dB) in order to be detected.
Detailed results and cough examples are provided in Appendix II - Cough Sound Examples and Appendix III - Detailed Test Results on 25 People’s Recordings.
Operations
The DEEPCRAFT™ Ready Model for Cough Detection is designed to detect and count cough events; note that sneezes and throat clearing sounds may be detected as coughing and contribute to the cough count. This model detects any cough event in its vicinity without distinguishing the person who coughed, which means that the model may detect the cough of someone else in the vicinity. Since the model is developed to work from 10 cm up to 2 meters, it may show performance degradation if a person coughs at less than 10 cm or more than 2 meters from the device and/or if there is an obstacle between the person and the device (such as a wall).
In conditions where the SNR of a cough event is too low compared to its background, the model may not be able to detect it. For instance, the noise of the device when covered by clothes can be louder than a cough event, making it difficult to detect. Take, for example, the case of a wrist-worn wearable; the user may keep their hands in a pocket and/or wear thick clothes over the wearable. It is recommended that this model should be used to look at coughing statistics and counts over a longer period, such as one hour, rather than looking at whether a single cough is detected or not.
Model Tech Specs and Deployment
The DEEPCRAFT™ Ready Model for Cough Detection processes sound data with the following characteristics:
- Sample rate: 16000 Hz
- Channels: 1 (Mono)
- Bit Depth: 16 bits
| Target board | Model version | library - Flash (KiB) | library - RAM (KiB | ml-middleware - Flash (KiB) | ml-middleware - RAM (KiB) | tflite-micro - Flash (KiB) | tflite-micro - RAM (KiB) |
|---|---|---|---|---|---|---|---|
| Any | ANSI C99 | 276.86 | 82.14 | N/A | N/A | N/A | N/A |
| PSOC™ 6 | float32 | 281.93 | 382.21 | 3.14 | 4.52 | 259.69 | 0.09 |
| PSOC™ 6 | int8x8 | 84.53 | 127.64 | 3.14 | 4.52 | 259.69 | 0.09 |
| PSOC™ Edge | float32 | 388.15 | 382.23 | 4.27 | 4.62 | 264.32 | 0.12 |
| PSOC™ Edge | int8x8 | 136.22 | 130.13 | 4.27 | 4.62 | 264.32 | 0.12 |
Memory-footprint calculation details are provided in Appendix IV - Memory Footprint Calculation.
For on-device testing and inference time calculation, the model uses C code generated for PSOC™ 6. It performs preprocessing in C and uses the ModusToolbox ML runtime to execute an int8x8 quantized TensorFlow Lite for Microcontrollers model. The inference time is about 150 ms when running on a PSOC™ 6 (model CY8CKIT-062S2-43012) overclocked to 150 MHz and mounting an IoT Sense expansion kit (model CY8CKIT-028-SENSE). The model outputs a prediction every 172 ms.
Data Set
This DEEPCRAFT™ Ready Model was built using various positive and negative data. The positive data consists of coughs from different individuals occurring in different environments and at different distances. The negative data represents different kinds of sounds that can occur both indoors and outdoors. Both kinds of data are listed in the following sections.
Positive Data
The positive data used to build the model consists of sound recordings with one or more cough events per file. Both dry and wet coughs have been used. The length of such files ranges from one second to about three minutes but most of them have a length below two minutes.
In the positive data, we can distinguish two different types of coughs:
- Short, single cough: its length is about 200-300 ms and it is separated from the previous cough and next one by at least 300 ms of non-cough data
- Long, multiple cough: it consists of multiple coughs, 2 or more, that are separated from the previous cough and next one by less than 200-300 ms of non-cough data
In Appendix II - Cough Sound Examples, links to YouTube examples are provided for these two types of coughs.
Negative Data
The model has been built using sound recordings of the following negative sound categories:
Indoor:
- Airplane cabin
- Alarms
- Blender
- Carillon
- Cat
- Cello and violin
- Classic and electric guitar
- Dish washing
- Dishes, cups, cutlery
- Dishwasher
- Dog
- Door
- Drilling
- Electrical shaver
- Elevator
- Flute and saxophone
- Frying
- Generic kitchen
- Glass break
- Hairdryer
- Hammering on different materials
- Ice cubes in a glass
- Jingle
- Microwave
- Music
- Phone ringtones
- Piano
- Running water
- Sawing
- TV and radio
- Vacuum cleaner
- Washing machine
- Water boiler
- Water running
Outdoor:
- Airplane
- Birds
- Car horn
- Church bell
- Construction site
- Cow
- Engine sounds from various vehicles
- Fireworks
- Forest
- Fountain
- Horse
- Inside various vehicles
- Ocean waves
- Rain
- Sheep and goat
- Shop and supermarket
- Sirens
- Sport events
- Thunderstorm
- Train horn
- Wind
- Wood chopping
People:
- Baby cry and laughing
- Breathing
- Breathing
- Child screaming
- Children playing
- Clapping
- Clearing throat
- Dinner
- Exhaling
- Foot steps
- Inhaling
- Laughing
- People talking in different environments like bars, restaurants, streets, shops
- Screaming Shouting
- Sighing
- Sneezing
- Snoring
- Whistling
Other:
- Pink noise
- White noise
Model Evaluation
In this section we present the evaluation of the model. The model was evaluated in three ways, each described in one of the following subsections:
- Validation set results: performance on the validation set used during model development.
- Test results on 25 people’s recordings: performance on recordings from 25 people not part of the training data.
- On-device test results: real-time performance with the model deployed on a PSOC™ 6 board.
We evaluate model performance at two levels: file level and sliding-window level. At file level, each sound file counts as one result: a positive file is classified as detected if the model triggers at least once anywhere in the file, and a negative file is classified as a false positive if the model triggers at least once anywhere in the file. At sliding-window level, each model input window and resulting prediction counts as one result.
Validation Set Results
The performance of the model on the validation set indicates that a good balance between true positives and false positives is achieved when using a confidence threshold equal to 80%. The model’s performance is summarised in the two tables below, the so-called confusion matrices. The percentages are normalised within each actual class column, so the diagonal values are recall values for the corresponding class:
- Top Left Value (Negative Recall / True-Negative Rate): actual negative data predicted as negative
- Bottom Left Value (False-Positive Rate): actual negative data predicted as positive
- Top Right Value (False-Negative Rate): actual positive data predicted as negative
- Bottom Right Value (Positive Recall / True-Positive Rate): actual positive data predicted as positive
This sliding-window-level evaluation uses short windows rather than whole files and can overestimate False Negatives. In particular, this means that the True Positives percentage, equal to 77%, in the table below sets roughly a lower limit of the real True Positives of this model.
| Sliding-Window-Based Confusion Matrix | Actual negative | Actual cough |
|---|---|---|
| Predicted negative | 99.47 % | 22.86 % |
| Predicted cough | 0.53 % | 77.14 % |
Table 2: Sliding-window-based confusion matrix on the validation set.
However, in this case, another way to interpret the high value for the False Negatives is that the model may miss single, short cough events which are typically about 200-300 ms but perform better on multiple coughs (check the Data Set section and Appendix II - Cough Sound Examples for the definition of these two types of coughs). This is confirmed by a more accurate analysis of the results.
On the other hand, the following confusion matrix looks at the coughs at file level. This shows if at least one cough event is detected in cough data ranging from 10 seconds to 3 minutes in length with most being below 2 minutes.
| Files-Based Confusion Matrix | Actual negative | Actual cough |
|---|---|---|
| Predicted negative | 96.96 % (830 files) | 16.03 % (156 files) |
| Predicted cough | 3.04 % (26 files) | 83.97 % (817 files) |
Table 3: Files-based confusion matrix on the validation set.
We see that the True Positives percentage is about 84%.
From the files-based confusion matrix, we see also that the False Positives occur in 3% of the negative files and they are caused by the following sound categories:
- Laughing
- Screaming / shouting
- Inhaling / exhaling
- Talking
- Horse neighing
- Dish / cups / cutlery sounds
- Guitar playing
- Children playing
All other categories included in the training (see the list in the previous section) do not trigger any cough. The complete list of false positives per category is shown in the histogram plot below. There the blue bar and the values on the left side refer to the number of files in each category where at least one cough event is detected. The orange bar and the values on the right side indicate in how many files no coughs are detected.
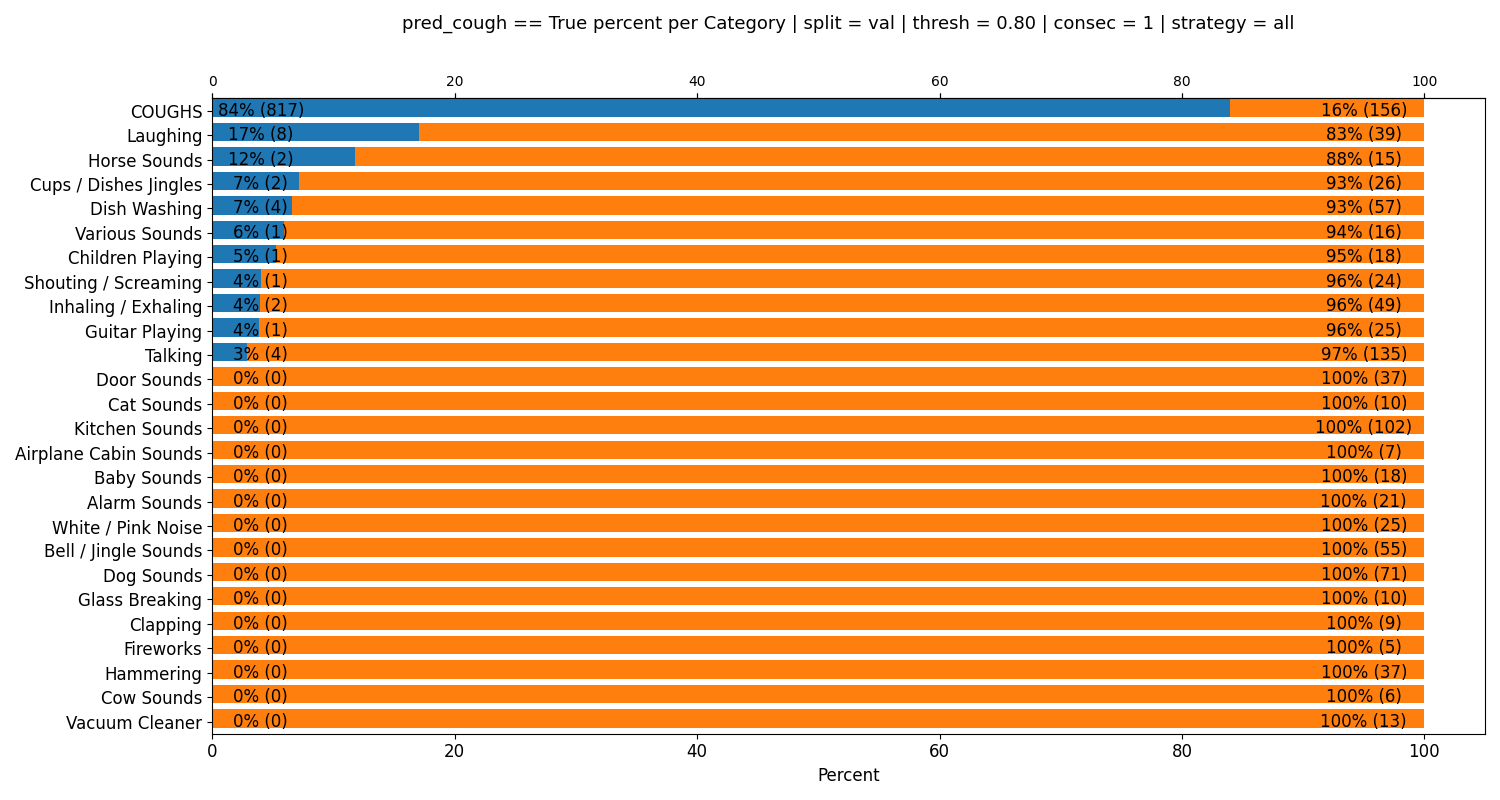
Figure 1: False positives per category on the validation set at file level.
From this histogram, it is clear that the Laughing category contributes the most. To understand better the impact of the False Positives on each hour when the model is running, we refer to the histogram plot below showing the False Positives per hour per category.
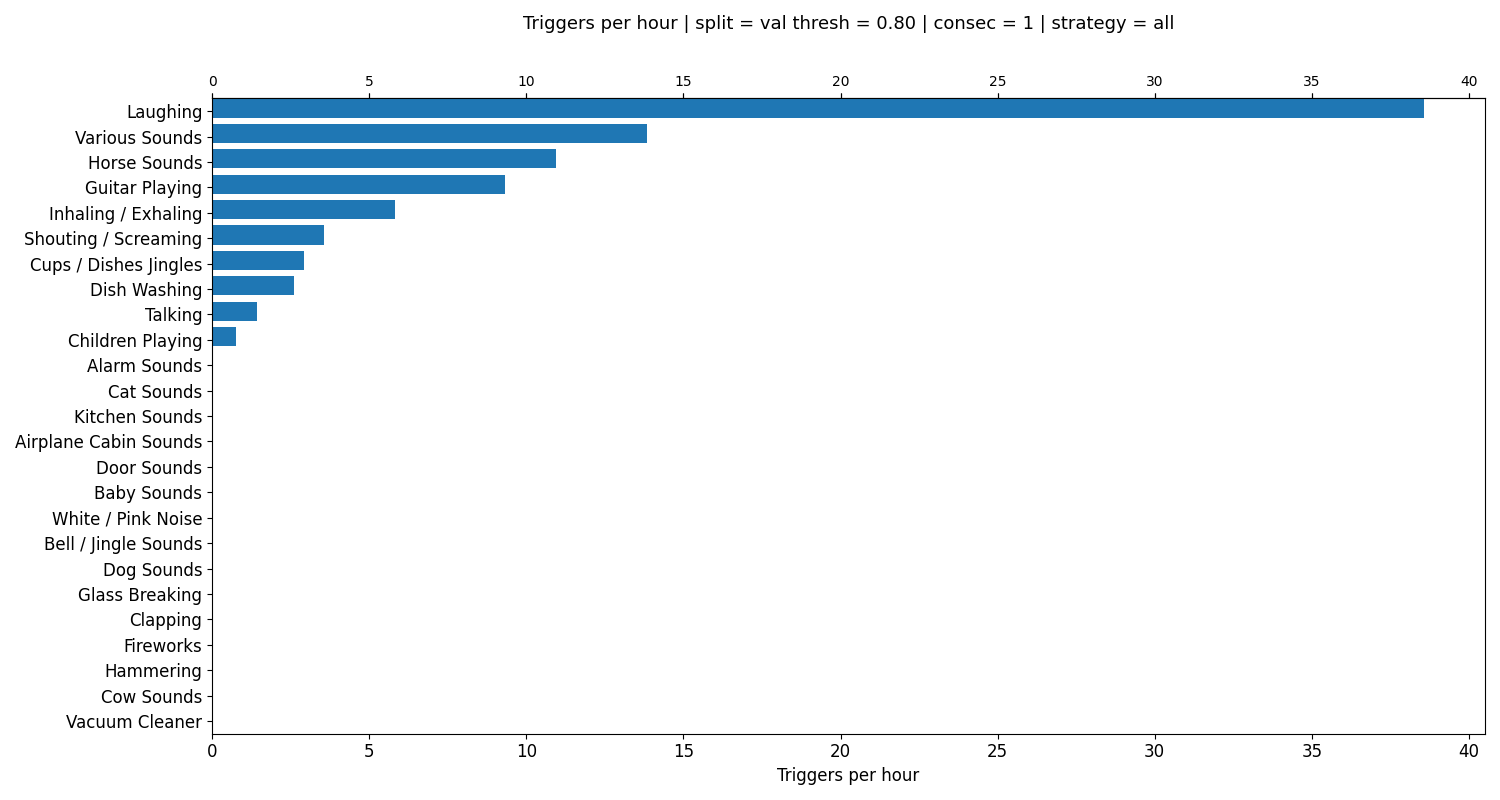
Figure 2: False positives per hour per category on the validation set.
We see that the Laughing category is expected to have the biggest rate per hour, while the impact of the other categories is much less. Notice that the numbers of False Positives per hour reported in the histogram above are an overestimate of the actual values since they do not represent a real case scenario.
Test Results on 25 People’s Recordings
We tested the model on data from 25 people that were not part of the training. We recorded cough events at distances ranging from 10 cm to 2 m and using both a phone and the PSOC™ 6. We report the results of this testing in the table in Appendix III - Detailed Test Results on 25 People’s Recordings.
The recall value for this test turned out to be 77.5% using an 80% confidence threshold as the only post-processing. Only eight participants were sick and had actual coughs. The remaining participants simulated coughs based on their typical coughing patterns.
Some of the recorded data consisted of negative sounds from the following categories:
- Laughing
- Talking
- Playing piano
- Typing on laptop
- Kitchen sounds / washing dishes
- Tv playing
- Music playing
- Dryer running
- Whistling
- Sighing
- Dishwasher
Only one false positive was triggered by people talking on a total of 442 seconds of negative data, which means eight false positives per hour.
On-Device Test Results
We performed on-device testing with six of the 25 people involved in the testing discussed in the previous section. For this test, we deployed the model on a PSOC™ 6 (model CY8CKIT-062S2-43012) mounting an IoT Sense expansion kit (model CY8CKIT-028-SENSE) and used an 80% confidence threshold as the only post-processing. We summarise the results in the table below. We provide the definition of multiple and single coughs in the Data Set section. In Appendix II - Cough Sound Examples, we list examples from YouTube.
| People | Coughs Detected | Coughs Missed | False Positives |
|---|---|---|---|
| Person 1 | Loud coughs | Weak and short coughs and when music is playing in background | 0 on 1 hour of music playing, kitchen sounds, walking |
| Person 2 | Loud / multiple coughs | Short / single coughs and coughs further than 2 m | 0 on 2.5 hours of talking on phone, minimal talking, phone message tones, music from phone, TV, sneeze 4 on 1 hour of tea party with 12 people talking and laughing, plates and cups sounds, dog barking 0 on 15 min of baby fussing and people talking |
| Person 3 | 1 short / single cough detected from less than 1 m | 6 short / single coughs missed from less than 1 m | 0 on 25 min of talking on phone with speaker ON and kids talking and singing 0 on 1 hour of family dinner with 2 adults and 2 kids with various kitchen sounds and people talking |
| Person 4 | Loud and/or multiple coughs, especially at less than 1 m | WWeak and short coughs and/or close to and further than 2 m and/or certain types of cough | 0 on 1 hour in office environment 0 on some minutes of clapping, laughing, music playing from phone at 20 cm 0 on 30 min of home sounds |
| Person 5 | Loud and/or multiple coughs with no pause in between, especially at less than 1 m | Quick single coughs with pause in between and/or close to and further than 2 m | 0 on 10 minutes of clapping, laughing, growling, talking and circular sawing, drilling and leaf blowing coming from a speaker |
| Person 6 | Loud coughs and/or in a small room | Weak and/or muffled coughs and/or in big room, even with multiple coughs | Negative testing was not performed |
Table 4: On-device test results.
This test with the model running on-device shows that it is more likely to detect multiple coughs than short, single coughs. The detection increases if the cough is louder and/or closer to the device. This means that the model is more suitable for detecting more prominent coughs, such as louder or multiple coughs. We notice also that the model is robust against False Positives in different real case scenarios. During this test, the model triggered only 4 in about 7 hours of negative sounds, namely 0.6 triggers per hour. Another conclusion can be drawn based on the full results shown in Appendix III - Results of Model Testing on 25 People’s Recordings: for the eight participants identified as sick, the model detected 88 of 98 cough events, corresponding to 89.8% recall.
Summary
The evaluation shows that the model reliably detects serious coughing while remaining robust against false positives:
- On the validation set, the model detected 84% of the cough files and correctly classified 97% of the negative files.
- On recordings from 25 people, the model detected 290 of 374 cough events (77.5% recall), including 88 of 98 cough events from the eight participants identified as sick (89.8% recall).
- On-device, the model detected loud and multiple coughs well and produced only four false positives in about seven hours of negative sounds.
The model is more likely to detect multiple coughs than short, single coughs, and detection improves with louder coughs closer to the device. It is therefore recommended to use this model for coughing statistics over a longer period rather than for detecting every single cough.
Appendix I - Data Sources
The positive data have been downloaded from the following sources:
Whereas Freesound is a well established sound database website, CoughVid and Coswara are two crowdsourcing projects, including sound files with cough events of thousands of users around the world, aimed at developing AI models to detect if a person is sick with the Covid-19 disease.
The negative data has been downloaded from the following sources:
The datasets are licensed under a combination of CC0 1.0, CC BY 3.0, and CC BY 4.0.
Appendix II - Cough Sound Examples
Below we provide a list of sound examples for the two different cough types:
Short, single cough
- Short single cough example 1
- Short single cough example 2
- Short single cough example 3 (2nd and 4th coughing pattern)
Long, multiple cough
Appendix III - Results of Model Testing on 25 People’s Recordings
| Person | 10-15 cm | 50-70 cm | 1 m | 2 m | False Positives | Actual Coughs |
|---|---|---|---|---|---|---|
| 1 | 6 | 12 | 0 | 21 | ||
| 2 | 6 | 11 | 0 | 21 | ||
| 3 | 6 | 5 | 0 | 21 | ||
| 4 | 6 | 12 | 0 | 22 | ||
| 5 | 7 | 9 | 0 | 21 | ||
| 6 | 4 | 3 | 0 | 9 | ||
| 6 (tv playing) | 0 | |||||
| 7 (sick) | 4 | 5 | 0 | 9 | ||
| 8 | 10 | 11 | 0 | 22 | ||
| 9 (sick) | 12 | 13 | 0 | 25 | ||
| 10 | 3 | 4 | 0 | 11 | ||
| 11 | 9 | 6 | 0 | 20 | ||
| 12 (sick) | 3 | 0 | 5 | |||
| 13 | 4 | 3 | 0 | 7 | ||
| 14 | 10 | 9 | 0 | 20 | ||
| 14 (typing on laptop) | 0 | |||||
| 14 (kitchen sounds, washing dishes) | 0 | |||||
| 15 (sick) | 12 | 15 | 0 | 30 | ||
| 16 (sick) | 4 | 5 | 0 | 9 | ||
| 16 (dryer running) | 0 | |||||
| 17 | 5 | 9 | 0 | 15 | ||
| 17 (playing piano, singing, sighing, whistling) | 0 | |||||
| 18 | 4 | 5 | 0 | 9 | ||
| 19 | 5 | 7 | 0 | 12 | ||
| 20 | 1 | 1 | 0 | 9 | ||
| 21 | 2 | 2 | 0 | 7 | ||
| 22 (sick) | 5 | 0 | 5 | |||
| 23 (sick) | 7 | 0 | 10 | |||
| 24 (sick) | 3 | 0 | 5 | |||
| 25 | 2 | 3 | 0 | 29 | ||
| 25 (music) | 0 | |||||
| 25 (dish-washer) | 0 | |||||
| 25 (tv, talking, laughing) | 1 (inhaling/laughing) | |||||
| TOTAL | 32 | 51 | 57 | 150 | 1 | 374 |
Table 4: Detailed results of model testing on 25 people’s recordings. The distance columns report the number of coughs detected at each distance.
The average true-positive rate was 290/374 = 0.775, meaning that the model detected 77.5% of the cough events in this test. Overall performance was good for most participants, although performance was lower for person 20 and especially for person 25. The model generated only one false positive during 442 seconds of negative data.
Appendix IV - Memory Footprint Calculation
All memory values in the deployment table are KiB, where 1 KiB = 1024 bytes. Memory usage was measured by building the audio deployment examples with the GCC_ARM 14.2.1 compiler and its Debug configuration flags, then analyzing the generated linker map, as the examples existed on September 4, 2026:
The calculation parses the Linker script and memory map portion of the GNU linker map. Each input section is attributed to the generated model object, TensorFlow Lite for Microcontrollers (libtensorflow-microlite.a), or ML Middleware (libraries_shared/ml-middleware). The size reported for each input section is then added to the Flash and/or RAM total for its component according to its enclosing output section.
For PSOC™ 6, Flash is the sum of .text + .rodata + .data, and RAM is the sum of .data + .bss + .noinit. For PSOC™ Edge, Flash is the sum of .app_code_main + .app_code_itcm + .app_code_socmem + .ram_vectors + .cy_socmem_data + .data, and RAM is the sum of .app_code_itcm + .app_code_socmem + .ram_vectors + .cy_socmem_data + .data + .bss + .noinit + .cy_sharedmem. Sections that are stored in Flash and executed or initialized in RAM are counted in both totals. Consequently, these results describe the linked deployment example rather than a platform-independent measurement of the model alone.
The PSOC™ Edge Flash figures are currently overestimated because of a known bug in the code examples. A fix is work in progress, so the PSOC™ Edge Flash values should be treated as provisional until the corrected examples are available.