DEEPCRAFT™ Baby Cry Detection Ready Model Report
In this document, we describe the DEEPCRAFT™ Ready Model for Baby Cry Detection, an audio-based AI model developed by Imagimob, an Infineon Technologies company, that detects when there is a baby or young child crying. We provide details about the technical specifications of this machine learning model, its performance in common scenarios, and various test results for the model including the real-time testing on an Infineon PSOC™ 6 board.
-
This model is not certified for medical use. It must not be used as a medical device or as a substitute for adult supervision or professional childcare.
-
All recommendations, performance information, and other details mentioned in this report refer exclusively to the Ready Model included in the project. Any modification to the model — such as retraining, altering its architecture, or changing its parameters — is likely to invalidate these details, including the stated recommendations and performance metrics.
Model Specification
Model Overview
The DEEPCRAFT™ Ready Model for Baby Cry Detection is designed to detect crying in babies and young children between 0 to 4 years old. This model can be used in a smart baby product, for example to alert parents when crying is detected.
Expected Performance
The aim of this model is to detect crying events of babies and young children between 0 and 4 years old. Multiple subsequent detections may belong to the same crying session.
In the offline evaluation with 20 children, at least one cry was detected within 10 seconds for 19 children (95% participant-level detection). The model is designed for distances of up to 5 meters. It reacts better to loud, sustained crying (wailing and bawling) than to soft, sobbing crying (blubbering). The model is expected to be robust across genders, origins, ages within the 0 to 4 years range, and typical indoor negative sounds such as those listed in the Data Set section. A baby cry event, compared to its background, needs to have a Signal To Noise Ratio (SNR) of at least 10 decibels (dB) in order to be detected.
The recording-based evaluation with 20 children and its participant-level, event-level, and time-to-detection results are explained in the Test Results on 20 Children’s Recordings section, with detailed results provided in Appendix II - Detailed Test Results on 20 Children’s Recordings.
Operations
The model detects crying in its vicinity without distinguishing which child is crying, which means that it may also detect the crying of another child nearby. If the child is further away than 5 meters or there is an obstacle between the child and the device, performance may degrade. In conditions where the SNR of a baby cry event is too low compared to its background, the model may not be able to detect it. For instance, soft crying or noise from the device or surrounding environment can be louder than the cry, making it difficult to detect. The model does not detect every single cry sound; it is recommended to consider a crying session detected if at least one detection is triggered during the session.
Model Tech Specifications and Deployment
The DEEPCRAFT™ Ready Model for Baby Cry Detection processes sound data with the following characteristics:
- Sample rate: 16000 Hz
- Channels: 1 (Mono)
- Bit Depth: 16 bit
| Target board | Model version | library - Flash (KiB) | library - RAM (KiB) | ml-middleware -Flash (KiB) | ml-middleware - RAM (KiB) | tflite-micro - Flash (KiB) | tflite-micro - RAM (KiB) |
|---|---|---|---|---|---|---|---|
| Any | ANSI C99 | 77.13 | 100.89 | N/A | N/A | N/A | N/A |
| PSOC™ 6 | float32 | 82.41 | 182.08 | 3.14 | 4.52 | 259.69 | 0.09 |
| PSOC™ 6 | int8x8 | 31.35 | 72.85 | 3.14 | 4.52 | 259.69 | 0.09 |
| PSOC™ Edge | float32 | 187.63 | 182.10 | 4.27 | 4.62 | 264.32 | 0.12 |
| PSOC™ Edge | int8x8 | 87.37 | 81.66 | 4.27 | 4.62 | 264.32 | 0.12 |
Memory-footprint calculation details are provided in Appendix III - Memory Footprint Calculation.
For on-device testing and inference time calculation, the model uses C code generated for PSOC™ 6. It performs preprocessing in C and uses the ModusToolbox ML runtime to execute an int8x8 quantized TensorFlow Lite for Microcontrollers model. The inference time is about 127 ms when running on a PSOC™ 6 (model CY8CKIT-062S2-43012) overclocked to 150 MHz and mounting an IoT Sense expansion kit (model CY8CKIT-028-SENSE). The model outputs a prediction every 172 ms.
Data Set
The DEEPCRAFT™ Ready Model has been built using various positive and negative sounds. The positive sounds are child cries from different individuals occurring in different indoor environments. The negative data represents different kinds of sounds that could happen indoors. The sounds are listed in the next sections.
Positive Data
The positive data consists of recordings of crying babies and young children, captured in different background environments. The cries come from children of different genders, different origins and ages between zero and four years. We randomly chose 20 children and tested on their crying and non-crying sounds to make sure that the model generalises to different kinds of child sounds.
Negative Data
To reduce false positives, the model has been built using sound recordings of the following negative sounds from indoor and outdoor categories:
- Adult laughing
- Adult talking
- Alarms
- Blender
- Bottle opening
- Cat
- Computer
- Different instruments
- Dish washing
- Dishes, cups, cutlery
- Dishwasher
- Dog
- Door
- Drilling
- Electrical shaver
- Firework
- Frying food
- Generic kitchen
- Glass break
- Hairdryer
- Hammering
- Microwave
- Music
- Other child sounds: babbling, laughing, talking and whining
- Running water
- Sawing
- Shower
- Toothbrush
- Traffic
- TV/radio
- Vacuum cleaner
- Washing machine
- Water boiler
Model Evaluation
In this section we present the evaluation of the model. The model was evaluated in four ways, each described in one of the following subsections:
- Validation set results: performance on the validation set used during model development.
- Test set results: performance on a separate test set of negative sounds.
- Test results on 20 children’s recordings: performance on recordings from 20 children not part of the training data.
- On-device test results: real-time performance with the model deployed on a PSOC™ 6 board.
We evaluate model performance at two levels: file level and sliding-window level. At file level, each sound file counts as one result: a positive file is classified as detected if the model triggers at least once anywhere in the file, and a negative file is classified as a false positive if the model triggers at least once anywhere in the file. At sliding-window level, each model input window and resulting prediction counts as one result.
Validation Set Results
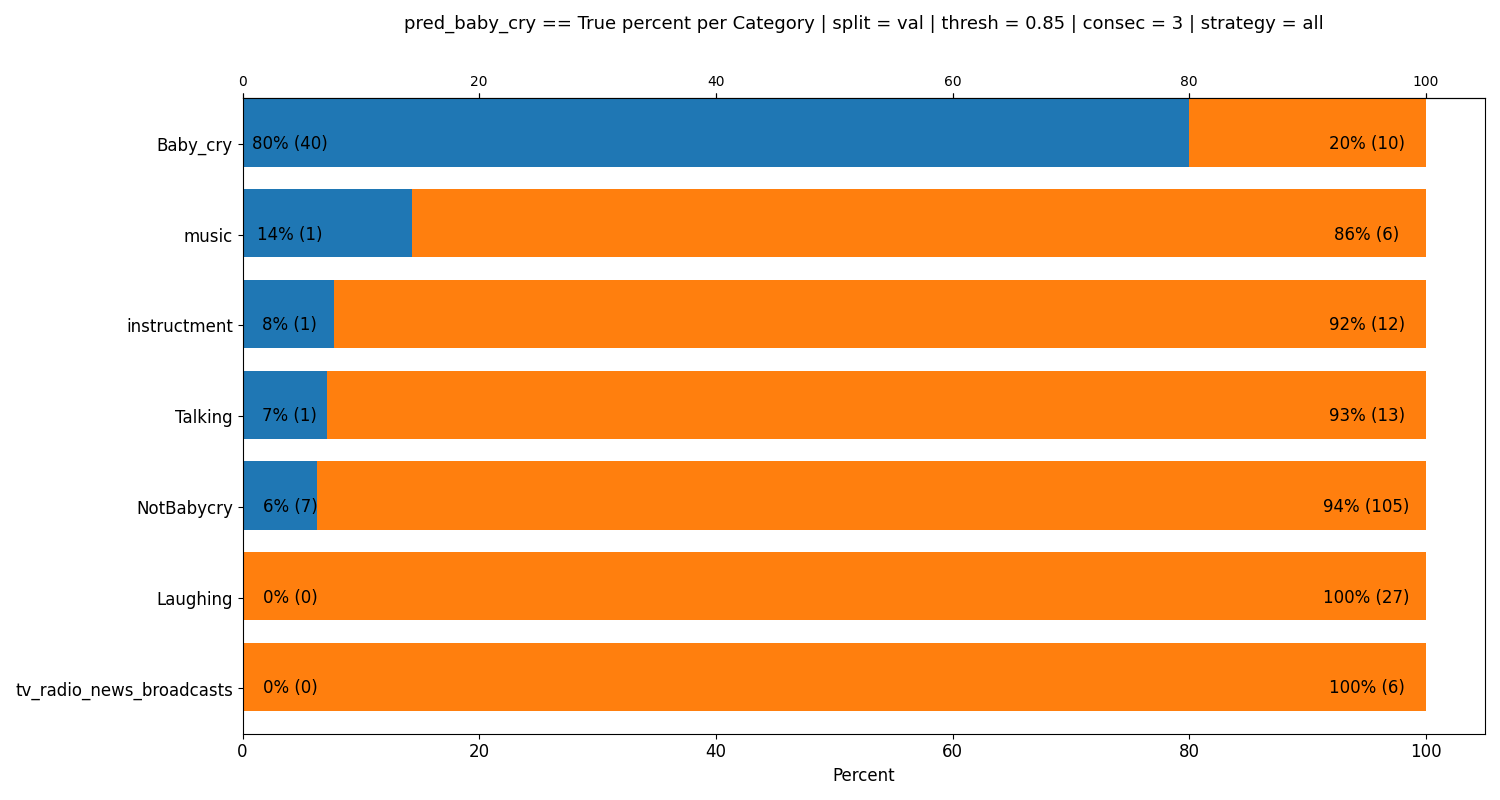
Figure 1: Validation set predictions per category at file level.
The plot above shows the predictions on the validation set at file level. For this evaluation, a detection is triggered when the model output exceeds a confidence threshold of 85% for three consecutive predictions.
As we can see from the plot, the model predicts 80% of the baby crying files correctly. There are some false positives (FPs) on the negative data: the 7 false positives among the negative sound files were caused by angry cat, electrical shaver and siren sounds. Siren recordings may have been evaluated only during testing or grouped under the broader alarm category; the Negative Data list is representative rather than exhaustive.
The confusion matrix below summarizes the performance of the model on the validation set, as reported by DEEPCRAFT™ Studio. The percentages are normalized within each actual class column, so the diagonal values are recall values for the corresponding class:
- Top Left Value (Negative Recall / True-Negative Rate): actual negative data predicted as negative
- Bottom Left Value (False-Positive Rate): actual negative data predicted as positive
- Top Right Value (False-Negative Rate): actual positive data predicted as negative
- Bottom Right Value (Positive Recall / True-Positive Rate): actual positive data predicted as positive
| Confusion Matrix (Validation Set) | Actual negative | Actual baby cry |
|---|---|---|
| Predicted negative | 95.12 % | 22.75 % |
| Predicted baby cry | 4.88 % | 77.25 % |
Table 2: Confusion matrix of the validation set from DEEPCRAFT™ Studio.
The confusion matrix uses the sliding-window-level results. The model correctly classified 95.12% of the sliding-window results in the negative data as negative, corresponding to a 95.12% negative recall. For the baby-cry data, it correctly detected 77.25% of the sliding-window results, corresponding to a 77.25% recall. The remaining 22.75% of false negatives means that the model may miss parts of a crying session, but as the file-level results above show, it detects most crying files when looking at the whole file.
Test Set Results
In addition to the validation set, the model was evaluated offline on a separate test set containing only negative sounds that were not used during training. The purpose of this test is to measure how robust the model is against false positives.
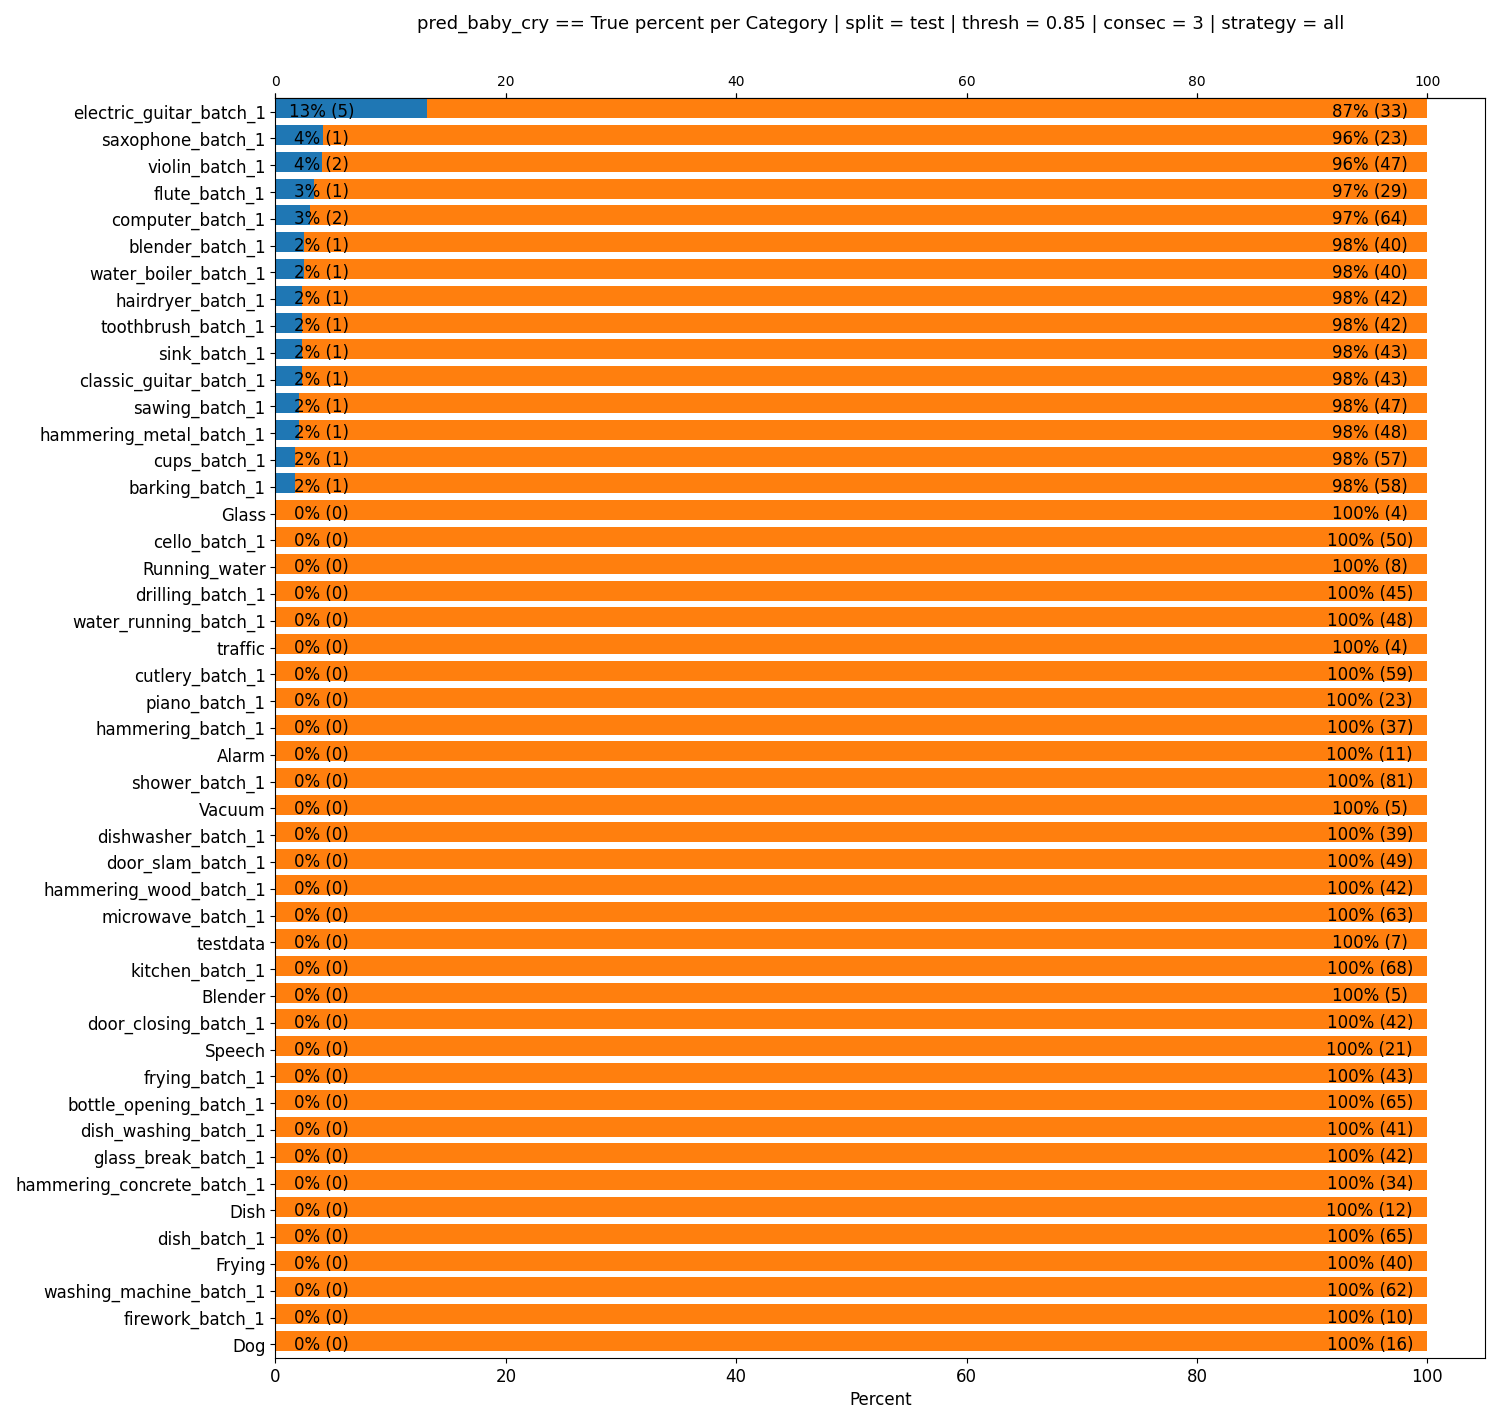
Figure 2: Test set predictions per negative sound category at file level.
This plot shows the prediction results for the different kinds of negative sounds in the test set. For this evaluation, a detection is triggered only when the model output exceeds a confidence threshold of 85% for three consecutive predictions.
Note for this plot:
- The model has the most problems with electric guitar sounds, even though the model was trained with such sounds.
- We only see a few false positives when using the 85% confidence threshold with three consecutive predictions. The confidence threshold can be reduced depending on the needs of the application, at the cost of more false positives.
Test Results on 20 Children’s Recordings
The model was evaluated offline using custom-collected and curated recordings from 20 children, 10 females and 10 males. The dataset was designed to assess generalisation across variables including age, origin, and environment. The recorded origins were China (10 children), the Philippines (1), the USA (8), and the Netherlands (1). Each crying file is 20 seconds long and each non-crying file is 10 seconds long.
The detailed results are listed in Appendix II - Detailed Test Results on 20 Children’s Recordings. A participant was counted as successfully detected when the model produced at least one output within 10 seconds of a crying event starting. By this participant-level criterion, crying was detected for 19 of the 20 children (95%). Counted separately at the event level, 56 of 103 annotated cry events were detected (approximately 54%).
The model performs differently on different types of crying. It reacts better to wailing and bawling, that is, loud, sustained and full-out crying, than to blubbering, that is, softer, sobbing crying mixed with other vocalisations.
For the non-crying sounds of the same 20 children, the model produced no false positives on 18 of the 20 files (90%). The model does not react to child laughing and babbling, but it triggered on some child yelling and whining sounds (2 false positives on one child’s yelling and 1 false positive on another child’s whining/talking, see Appendix II).
On-Device Test Results
We performed on-device testing with 4 different people. For these tests, the model was deployed on a PSOC™ 6 (model CY8CKIT-062S2-43012) mounting an IoT Sense expansion kit (model CY8CKIT-028-SENSE). Post-processing used 0.85 as confidence threshold and required 3 consecutive positive predictions to confirm an event. Three tests included child crying, while one contained only negative sounds.
The testing results are shown in the table below.
| Person | Duration | Sounds Tested | Crying Detection | False Positives |
|---|---|---|---|---|
| Person 1 | Two hours (board recording) | Home sounds, baby laughing, baby yelling, baby crying, music/TV background, people talking | All baby crying sessions detected | Two on baby yelling, two on music/TV background |
| Person 2 | Eight hours (live) | Office sounds such as keyboard typing, online meetings, walking; includes loud talking played from a speaker | No crying present (negative test) | Zero |
| Person 3 | One hour (live, in a car) | People talking, baby fussing, baby crying (zero to one year old, male), traffic sounds | One of two crying sessions detected; each session lasted two to three minutes | Zero |
| Person 4 | Less than 10 minutes | Baby crying (zero to one year old, female), people talking | Four of four crying sessions detected; sessions lasted 0.5 to three minutes. During the three-minute session, crying was detected but not every single cry triggered a detection | Zero |
Table 3: On-device test results.
Summary
The evaluation shows that the model detects most crying sessions while remaining robust against false positives:
- On the validation set, the model detected 80% of the baby crying files and correctly classified 95.12% of the negative timesteps.
- On the test set of negative sounds, only a few false positives occurred, mostly on electric guitar sounds.
- On recordings from 20 children, crying was detected for 19 of 20 children, and 18 of 20 non-crying files produced no false positives.
- On-device, the model detected crying in most sessions and produced only four false positives in about eleven hours of testing.
The model reacts better to loud, sustained crying than to soft crying, and it does not detect every single cry within a session. It is therefore recommended to consider a crying session detected if at least one detection is triggered during the session.
Appendix I - Data Sources
The positive data has one or more child cry events per file, with sound file length ranging from two seconds up. These files have been downloaded from the following sources: Freesound
The negative data has been downloaded from the following sources: Freesound and DESED / The datasets are licensed under a combination of CC0 1.0, CC BY 3.0, and CC BY 4.0.
Appendix II - Detailed Test Results on 20 children’s Recordings
Each child contributed evaluation files composed of crying and non-crying recordings. Crying files were normalized to 20 seconds and non-crying files to 10 seconds by shortening or extending recordings as needed. A participant-level detection was counted as successful when the model produced an output within 10 seconds of the crying event starting. The Crying result counts below report annotated cry events within those files.
| ID | Gender | Origin | Age (in years) | Crying result | Non-crying result |
|---|---|---|---|---|---|
| 58 | female | China | 1-2 | 3 out of 6 detected | Laugh, 0 FP |
| 61 | female | China | 1-2 | 3 out of 4 detected | Babbling, 0 FP |
| 60 | female | China | 2-3 | 3 out of 4 detected | Babbling, 0 FP |
| 63 | female | China | 3-4 | 1 out of 4 detected (sounds like the mouth was covered) | Talking, 0 FP |
| 65 | female | China | 3-4 | 3 out of 3 detected | Talking, 0 FP |
| 67 | female | China | 0-1 | 8 out of 9 detected | Babbling, 0 FP |
| 39 | female | Netherlands | 1-2 | 2 out of 5 detected (yelling, sounds like fake crying) | Laugh, 0 FP |
| 40 | female | USA | 0-1 | 6 out of 12 detected | Laugh, 0 FP |
| 42 | female | USA | 1-2 | 2 out of 5 detected | Laugh, 0 FP |
| 43 | female | USA | 3-4 | 3 out of 3 detected | Laugh, 0 FP |
| 4 | male | China | 1-2 | 5 out of 7 detected | Yelling “biii” sound, 2 FP |
| 5 | male | China | 3-4 | 0 out of 5 detected (sounds like the mouth is covered, no break-out crying) | Talking, 0 FP |
| 6 | male | Philippines | 1-2 | 1 out of 5 detected | Talking, 0 FP |
| 7 | male | China | 0-1 | 3 out of 3 detected | Babbling, 0 FP |
| 8 | male | China | 3-4 | 1 out of 5 detected (talking while crying) | Talking, 0 FP |
| 11 | male | USA | 2-3 | 1 out of 6 detected (not crying, more like whining) | Laugh, 0 FP |
| 10 | male | USA | 2-3 | 3 out of 4 detected | Laugh, 0 FP |
| 12 | male | USA | 0-1 | 4 out of 4 detected | Babbling, 0 FP |
| 15 | male | USA | 2-3 | 2 out of 6 detected | Laugh, 0 FP |
| 14 | male | USA | 2-3 | 2 out of 3 detected | Whining/talking, 1 FP |
Table 4: Detailed test results on 20 children’s recordings.
In summary, the model detected crying for 19 of the 20 children; the only child with no detections (ID 5) cried with a muffled sound, as if the mouth was covered. Counted pper cry event, 56 of 103 cries were detected. For the non-crying sounds, 18 of the 20 files produced no false positives; the model did not react to laughing, babbling or talking, but triggered 2 false positives on one child’s yelling (ID 4) and 1 false positive on one child’s whining/talking (ID 14).
Appendix III - Memory Footprint Calculation
All memory values in the deployment table are KiB, where 1 KiB = 1024 bytes. Memory usage was measured by building the audio deployment examples with the GCC_ARM 14.2.1 compiler and its Debug configuration flags, then analyzing the generated linker map, as the examples existed on September 4, 2026:
The calculation parses the Linker script and memory map portion of the GNU linker map. Each input section is attributed to the generated model object, TensorFlow Lite for Microcontrollers (libtensorflow-microlite.a) or ML Middleware (libraries_shared/ml-middleware). The size reported for each input section is then added to the Flash and/or RAM total for its component according to its enclosing output section.
For PSOC™ 6, Flash is the sum of .text + .rodata + .data, and RAM is the sum of .data + .bss + .noinit. For PSOC™ Edge, Flash is the sum of .app_code_main + .app_code_itcm + .app_code_socmem + .ram_vectors + .cy_socmem_data + .data, and RAM is the sum of .app_code_itcm + .app_code_socmem + .ram_vectors + .cy_socmem_data + .data + .bss + .noinit + .cy_sharedmem. Sections that are stored in Flash and executed or initialized in RAM are counted in both totals. Consequently, these results describe the linked deployment example rather than a platform-independent measurement of the model alone.
The PSOC™ Edge Flash figures are currently overestimated because of a known bug in the code examples. A fix is work in progress, so the PSOC™ Edge Flash values should be treated as provisional until the corrected examples are available.