Model Validation
After generating code for the model, use the validation options in Model Converter to verify the model behavior. You can visualize validation results on the desktop or validate the model directly on hardware by streaming data to a target device running the DEEPCRAFT Profiler Code Example for ModusToolbox™.
If you are using version 1.0.0 of the DEEPCRAFT Profiler Code Example, follow the instructions in Updating the code example to add streaming functionality to the application. See the Code Example README.md file for the version number.
Understanding Model Validation

You can validate the model using either the original model outputs or the reference outputs you provide. Configure the validation data and validation mode in the Code Generation tab.
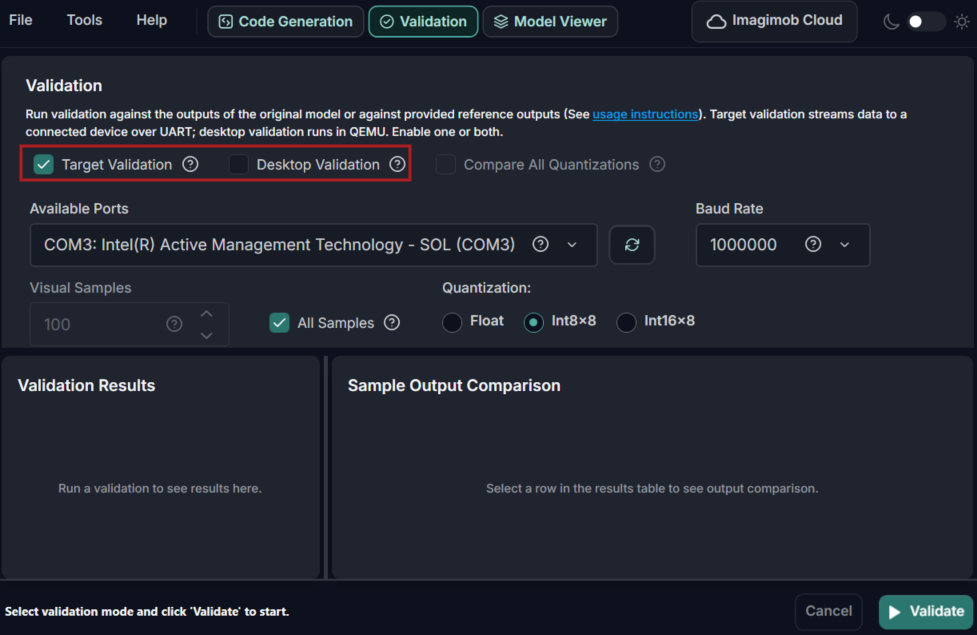
Model Converter provides two validation options: Target Validation and Desktop Validation. You can run either option individually or run both at the same time, depending on your requirements.
Target Validation streams validation data to the connected target device over UART. This option supports validation for one selected quantization configuration at a time.
Pre-requisites for Target validation:
-
Flash the target board using the Profiler Code Example using the code generated from the Code Generation tab.
-
Configure streaming in Code Example
Update theML_DATA_SOURCEvariable incommon.mkto use streamed data:# Choose which data source to use for the ML profiler # local - use local data # stream - stream data from the host PC ML_DATA_SOURCE=stream
Desktop Validation runs validation on the desktop using QEMU for the selected quantization configuration. You can also validate all supported quantization configurations and compare the results. This option is not available for PSOC™ Edge M55+U55.
Running model validation
To run model validation, follow the steps:
-
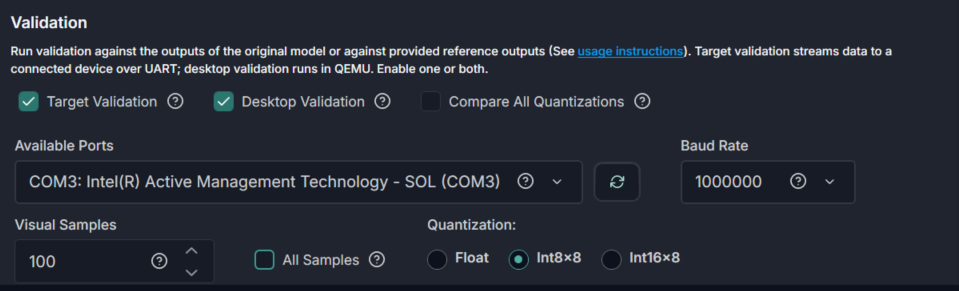
In Validation, enable Target Validation, Desktop Validation, or both.
-
In Quantization, select the quantization configuration for validation. The selected configuration determines the results shown in the table and graph, as well as the output files generated.
For Desktop Validation, you can select one or all quantization options. For Target Validation, you can select only one quantization option.
Select Compare All Quantizations to run desktop validation for all supported quantization variants and compare the Mean Absolute Error (MAE) for each variant. This helps evaluate post-training quantization accuracy. This option applies only when the input model selected in the Code Generation tab is a Keras model, such as .h5 or .keras. If you select a different model format, Model Converter ignores this option. You cannot use Compare All Quantizations with Target Validation.
-
In Available Ports, select the COM port connected to the board. If the required port does not appear in the list, click the refresh icon. This option appears only when Target Validation is selected.
-
In Baud Rate, select the baud rate for communication with the target device. The default value is
1000000. Keep the default value unless you changed the value in the DEEPCRAFT Profiler Code Example. This option appears only when Target Validation is selected. -
In Visual Samples, select the number of samples to display in the results window. By default, the window displays 100 samples. To display all samples, enable All Samples.
-
For large datasets, disable All Samples and limit the number of visualized samples if the application slows down or freezes.
-
The window sorts visualized samples by highest Mean Absolute Error (MAE), so the samples with the largest difference from the reference output appear first.
- Click Validate to start validation. The validation results are displays in the results window.
Result Window
The result window displays validation results in table, graph, and log formats.
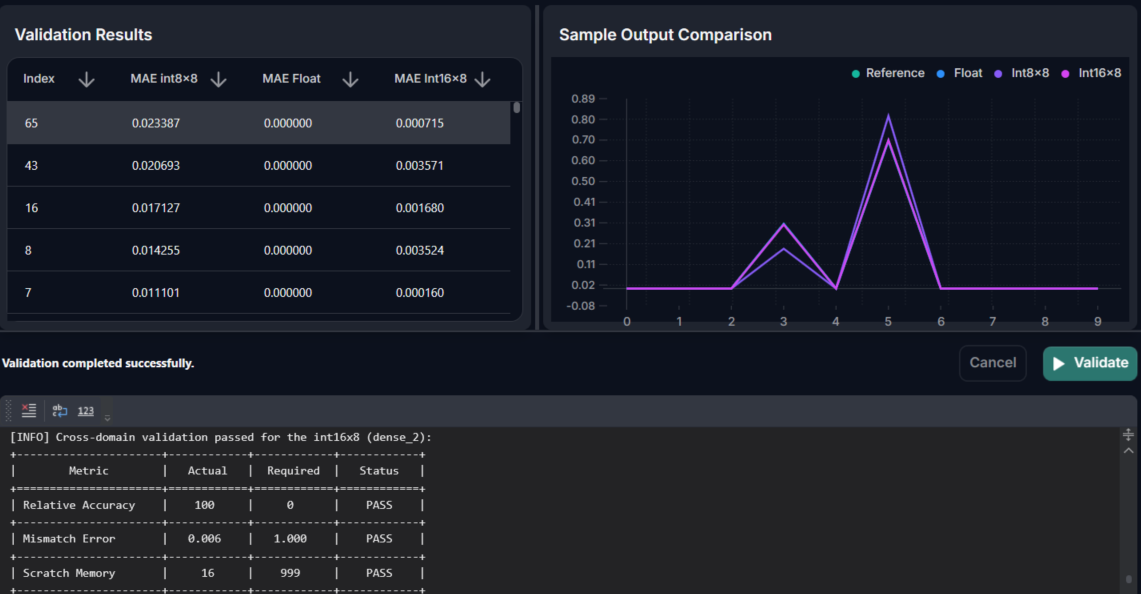
The Validation Results table shows each input index and the corresponding MAE value. Depending on the selected quantization options, the table can display up to three result columns. You can sort each column in ascending or descending order.
The Sample Output Comparison window displays the selected sample results as a graph. Select an index from the validation results table to view its output comparison. Use the colored graph icons to show or hide specific results. You can click and drag to pan across the graph, and click the sync icon to reset the graph view.
The Log window displays validation messages and result details.
Understanding Validation Results
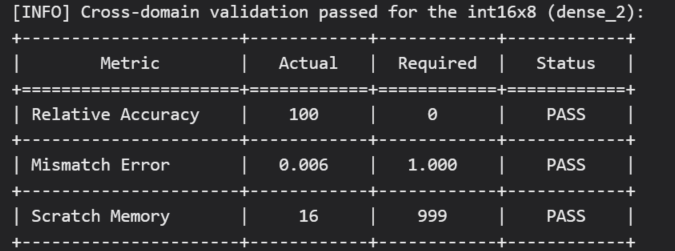
- Relative Accuracy: Shows the percentage of samples where the maximum output index matches between the reference output and the target output. This metric is most useful for classification models.
- Mismatch Error: Shows the maximum Mean Absolute Error (MAE) across all validated samples.
- Scratch Memory: Shows the memory required for intermediate computations during inference in KB. This memory is also known as tensor arena or working memory.